A portfolio of the graphics now live across OBWB platforms: what each one tells us, and where to find the live version.
36 graphics from 14 platforms, captured or regenerated 2 November 2026.
Platforms
Each graphic below links to the platform it came from. Values are as of the date shown with each graphic; most recent data are provisional real-time values, subject to revision.
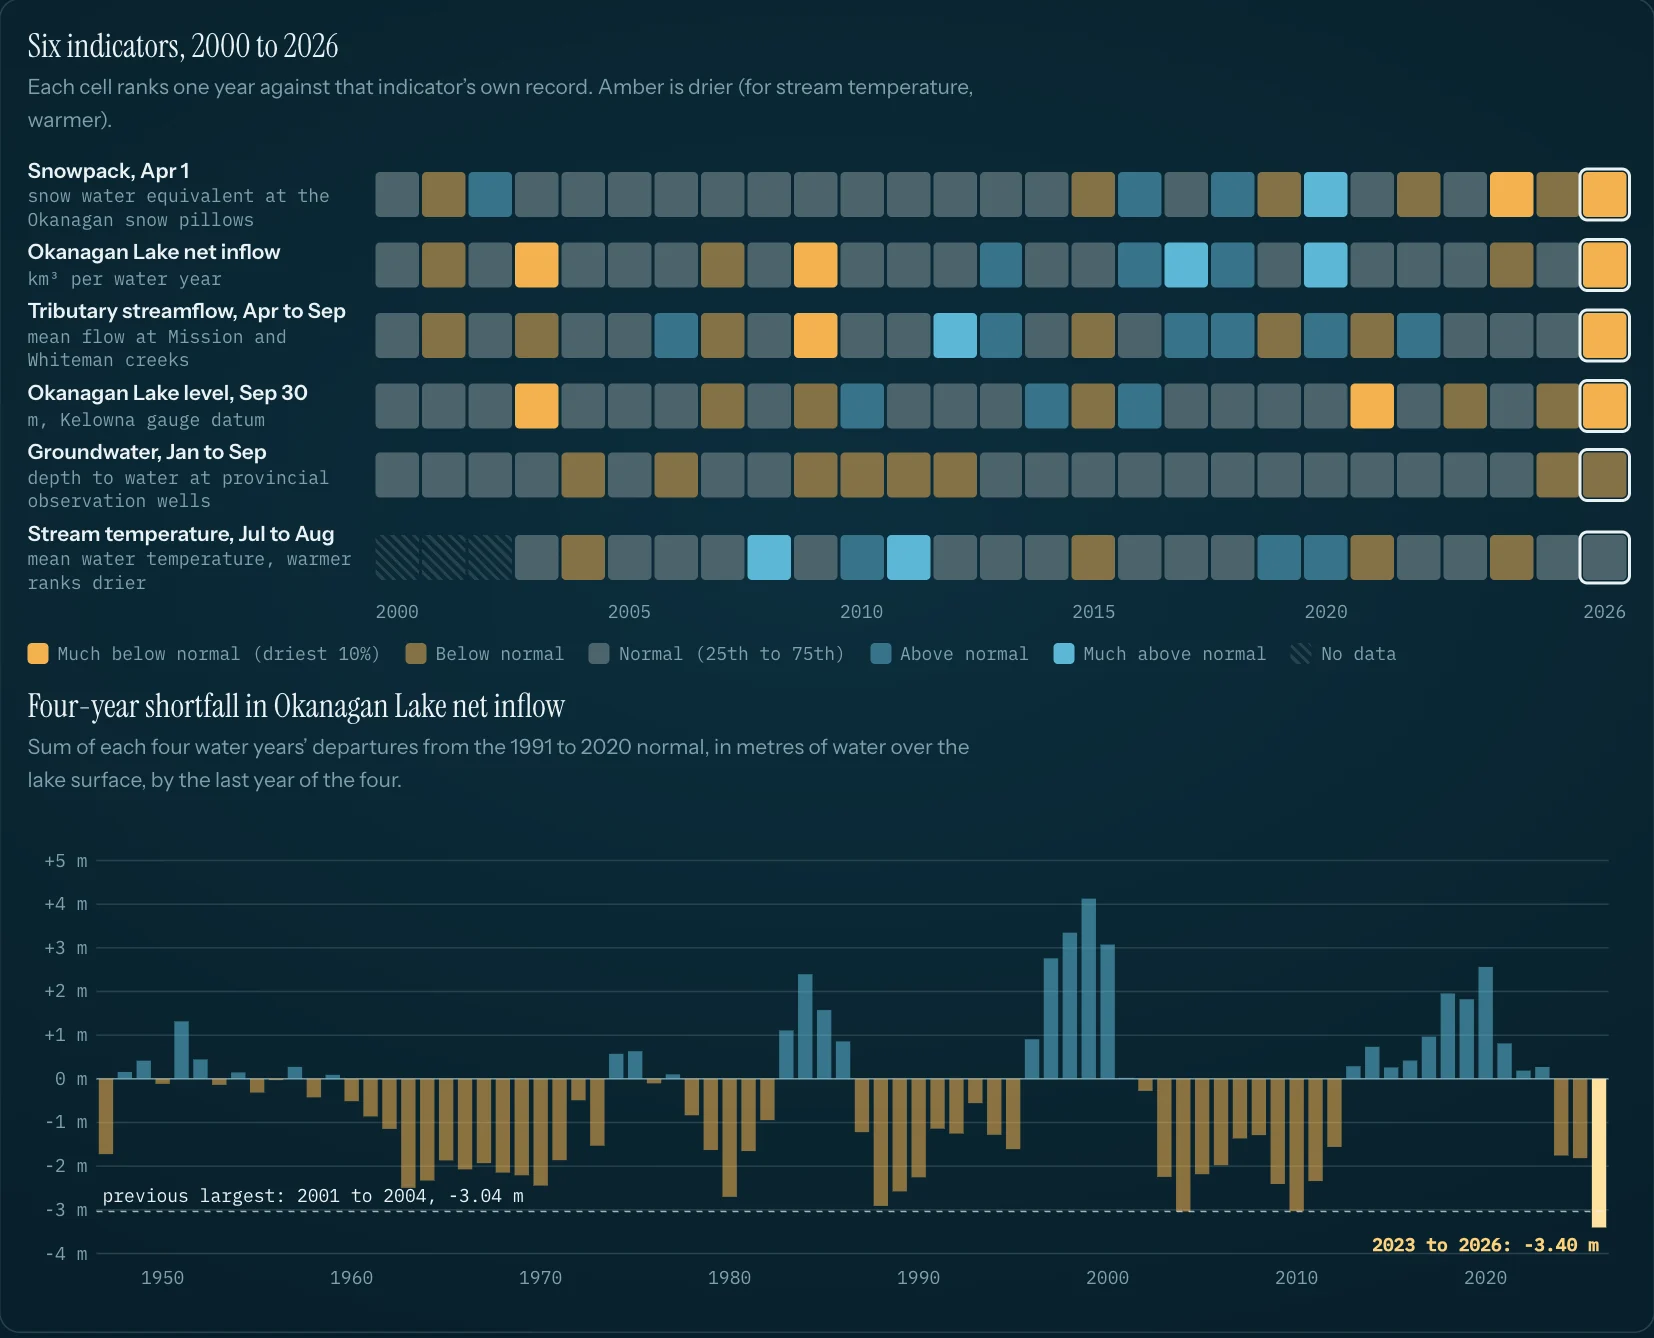
Each cell ranks one year against that indicator's own record; amber is drier. In 2026, five of six indicators were below normal: snowpack, lake inflow, tributary streamflow, lake level and groundwater. Stream temperature was within normal. The four-year net-inflow shortfall, WY2023 to 2026, is 3.40 m of lake level, the largest since 1944 (previous: 2001 to 2004, 3.04 m).
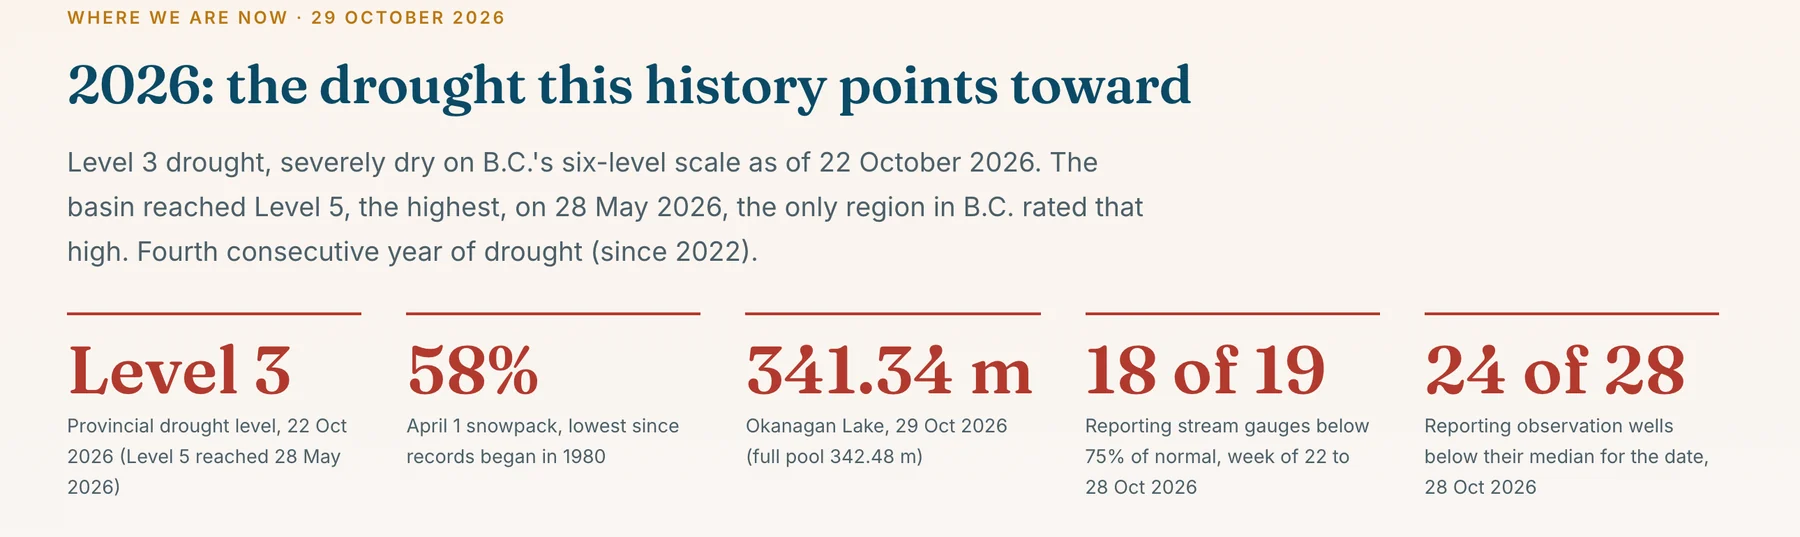
B.C. Drought Level 3 (22 Oct 2026); the basin reached Level 5 on 28 May. April 1 snowpack was 58% (published basin figure), the lowest since records began in 1980. Okanagan Lake was 341.34 m on 29 Oct (full pool 342.48 m). 18 of 19 reporting stream gauges were below 75% of normal. 2026 is the fourth consecutive drought year since 2022.
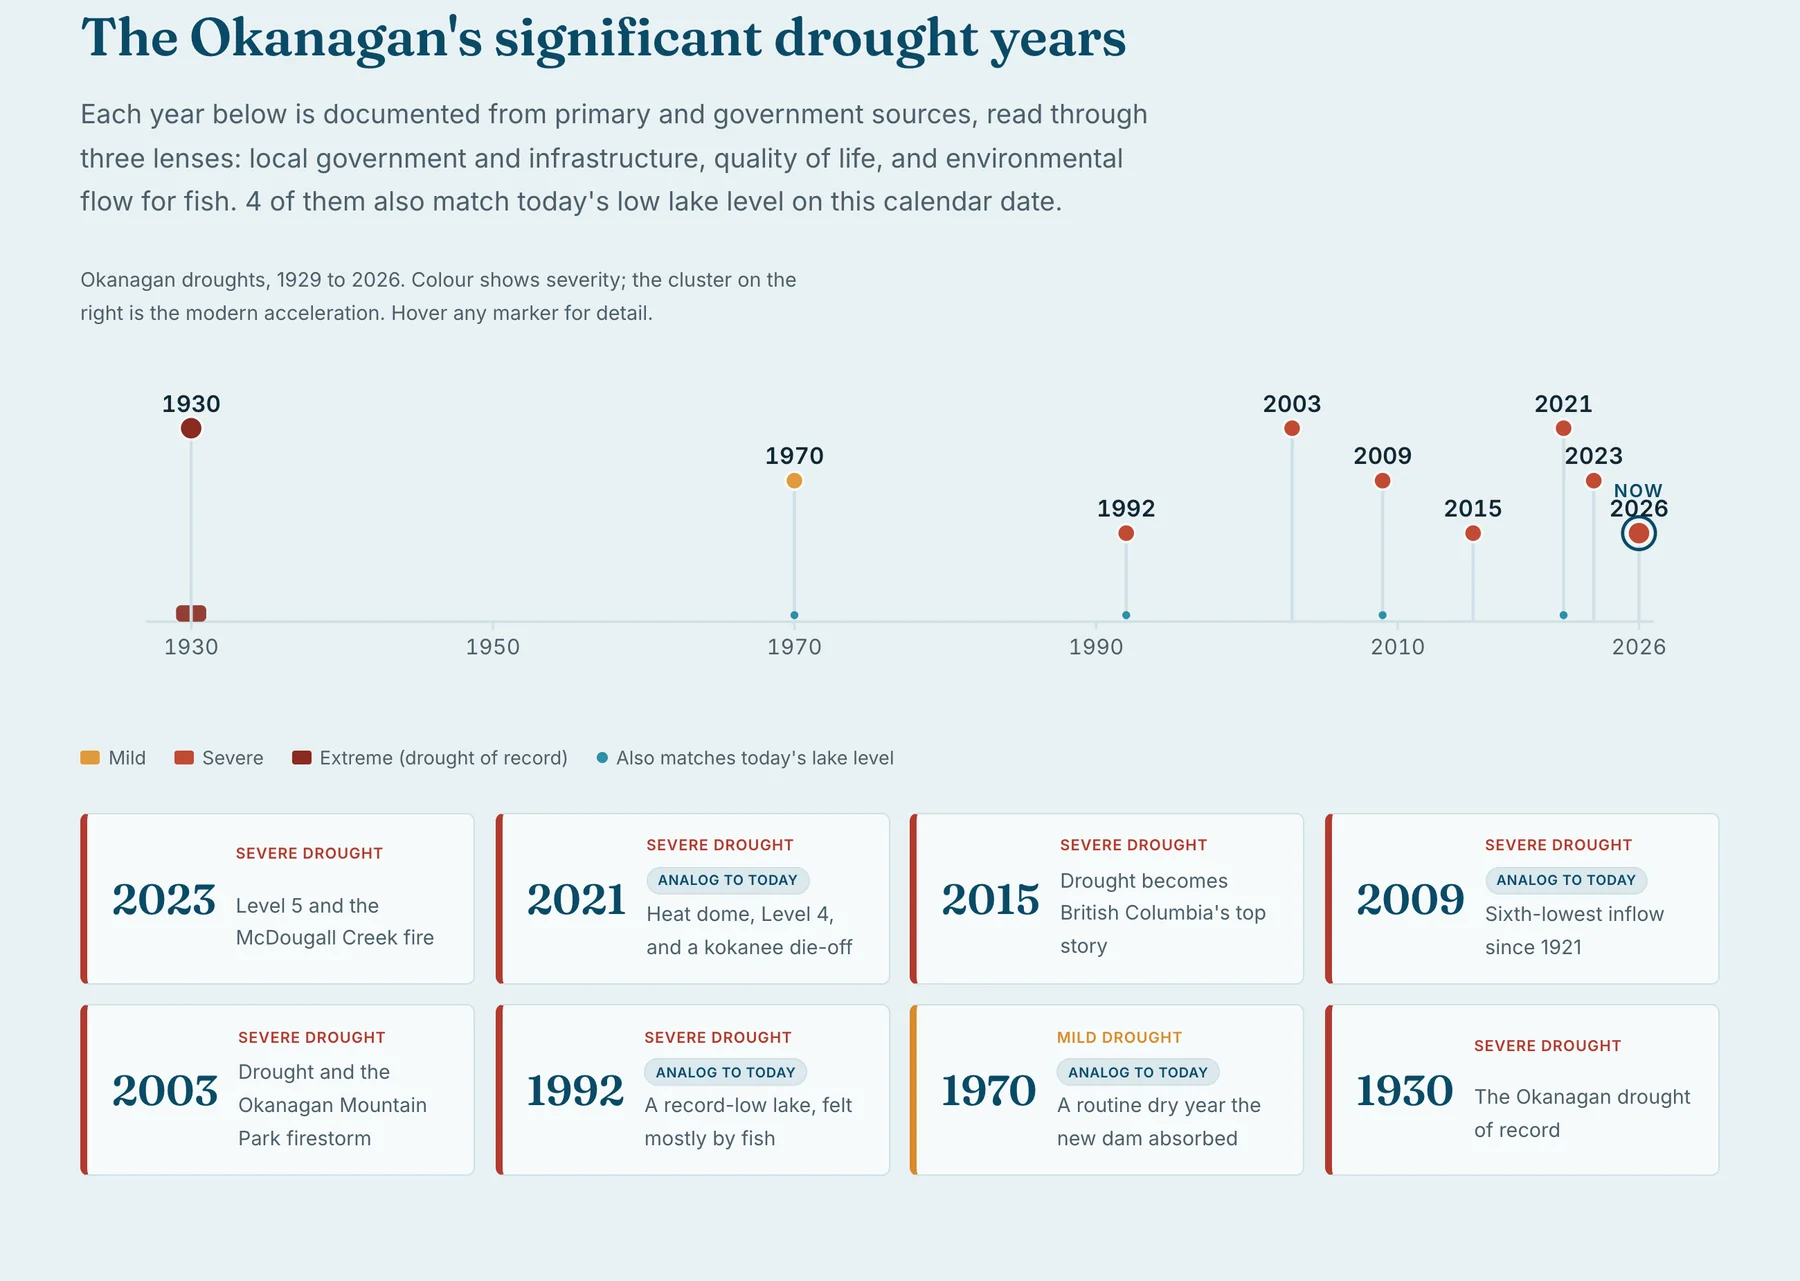
The Okanagan's significant drought years, 1929 to 2026
What this graphic tells us
Each documented drought year is read through three lenses: local government and infrastructure, quality of life, and environmental flow for fish. Every entry is sourced from primary or government records. Four of the years also match today's low lake level on this calendar date. The years cluster toward the right of the timeline.
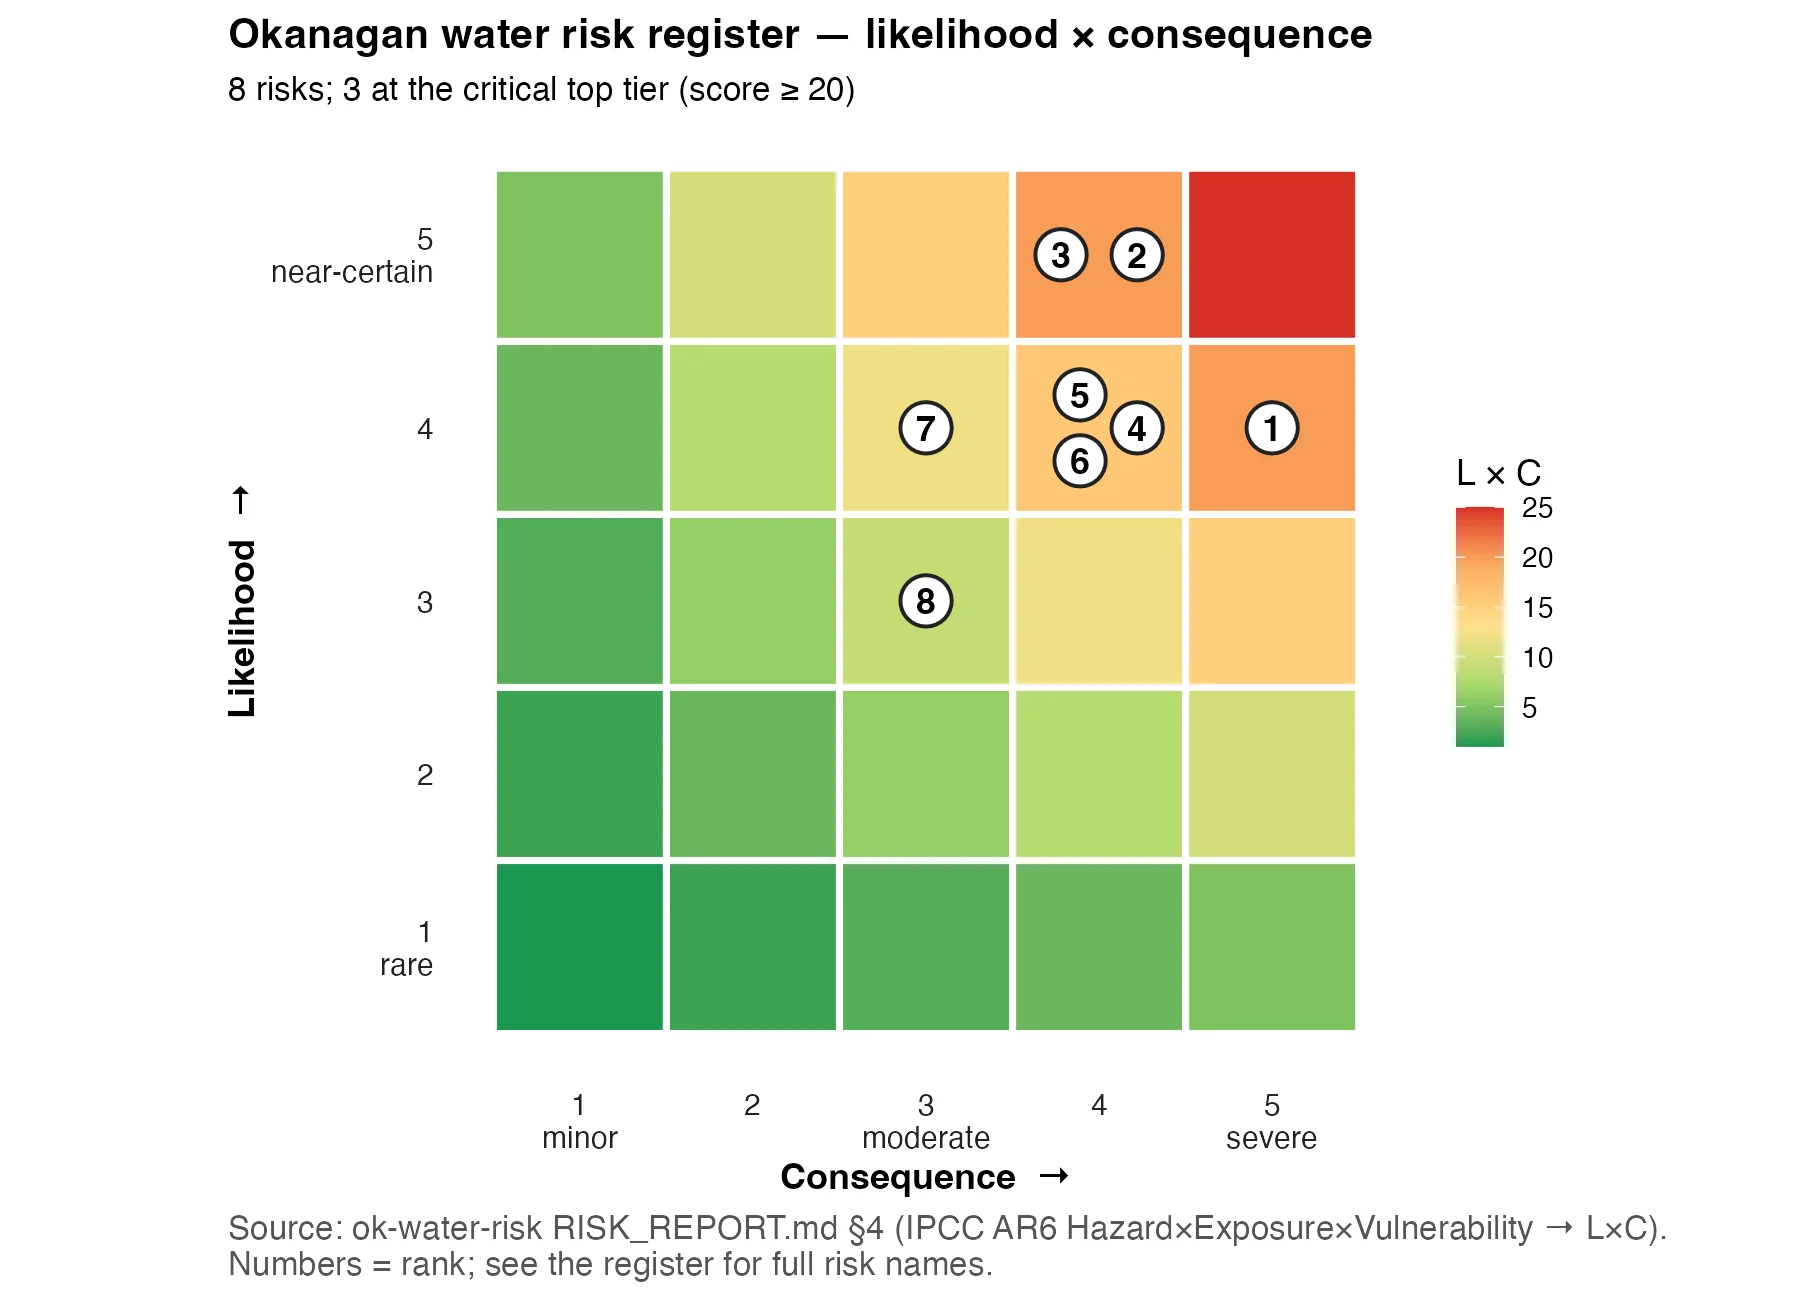
Eight basin water risks scored on likelihood and consequence (IPCC AR6 hazard, exposure, vulnerability). Three sit in the critical top tier (score 20 or more). Numbers are the risk ranks; the register on the report card names each one.
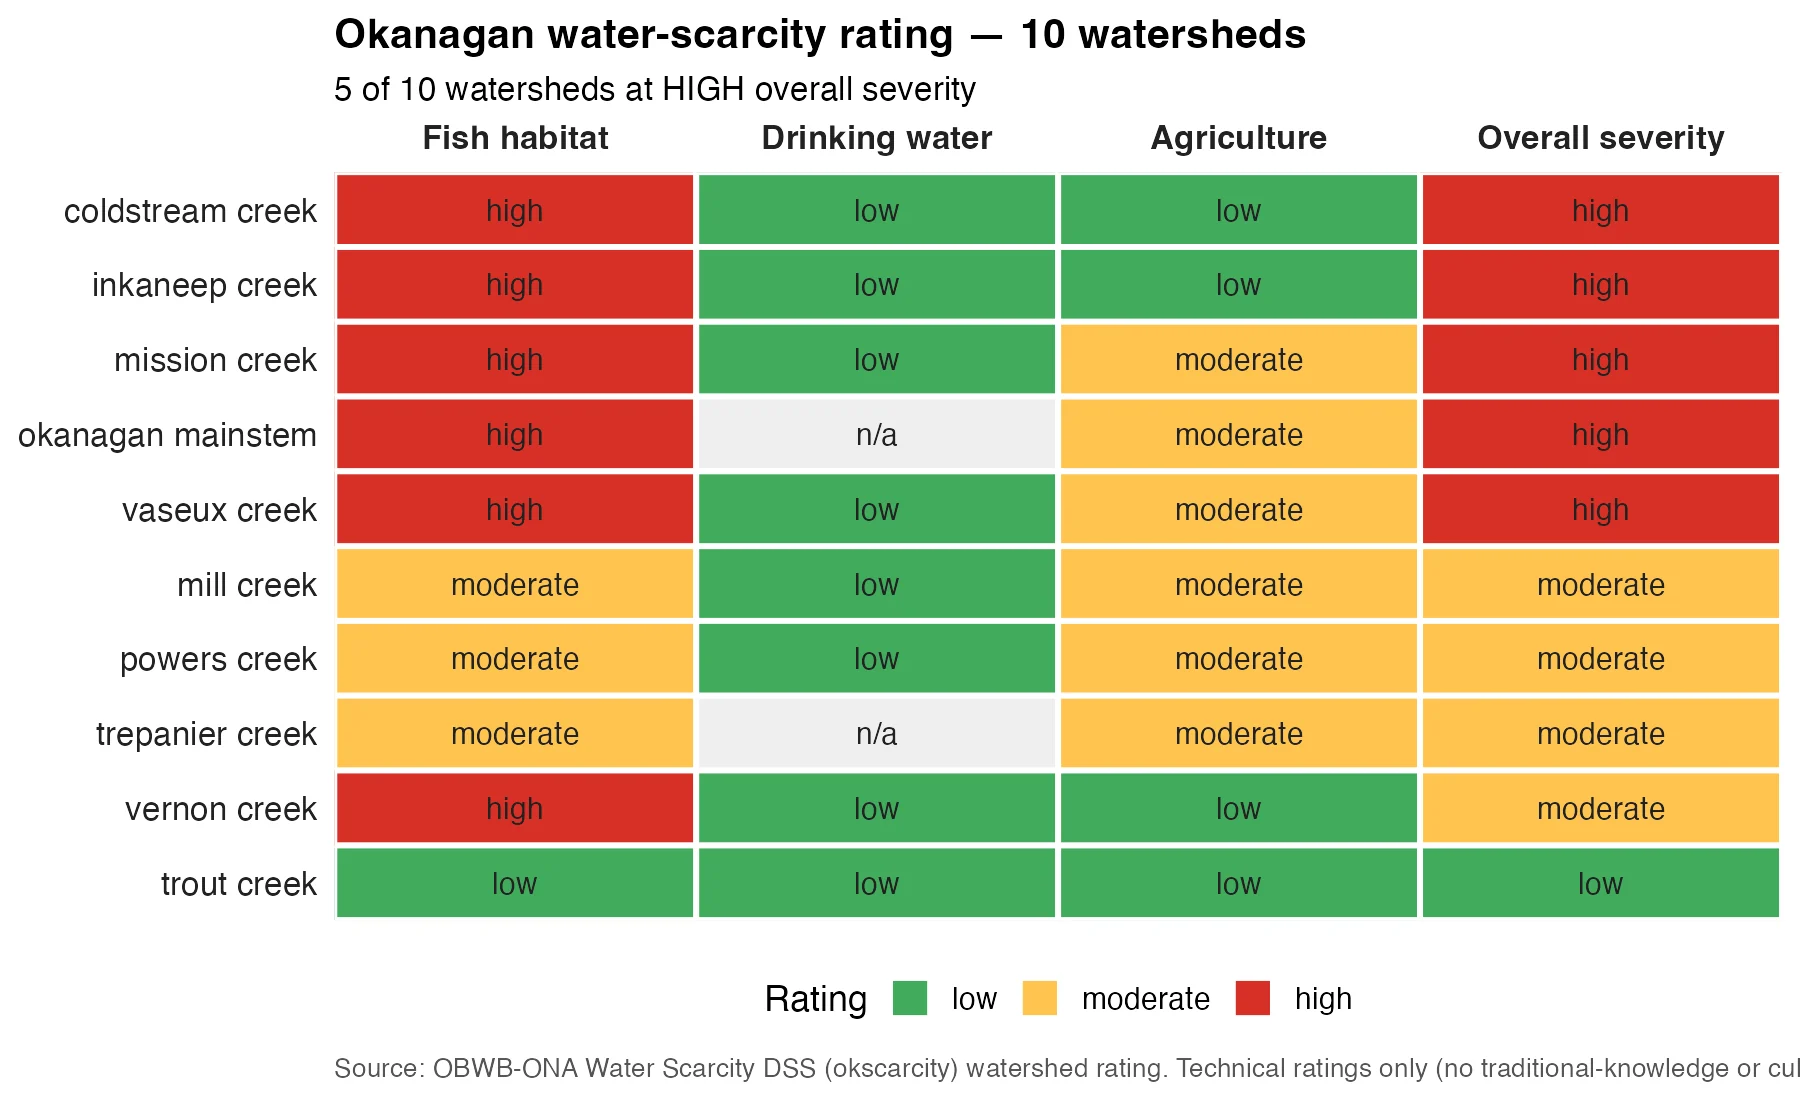
Five of ten rated watersheds are at HIGH overall severity: Coldstream, Inkaneep, Mission, Okanagan mainstem and Vaseux. Fish habitat drives every High rating. Drinking water is rated low in every watershed with a rating. Ratings are technical only; traditional knowledge and cultural values are not included.
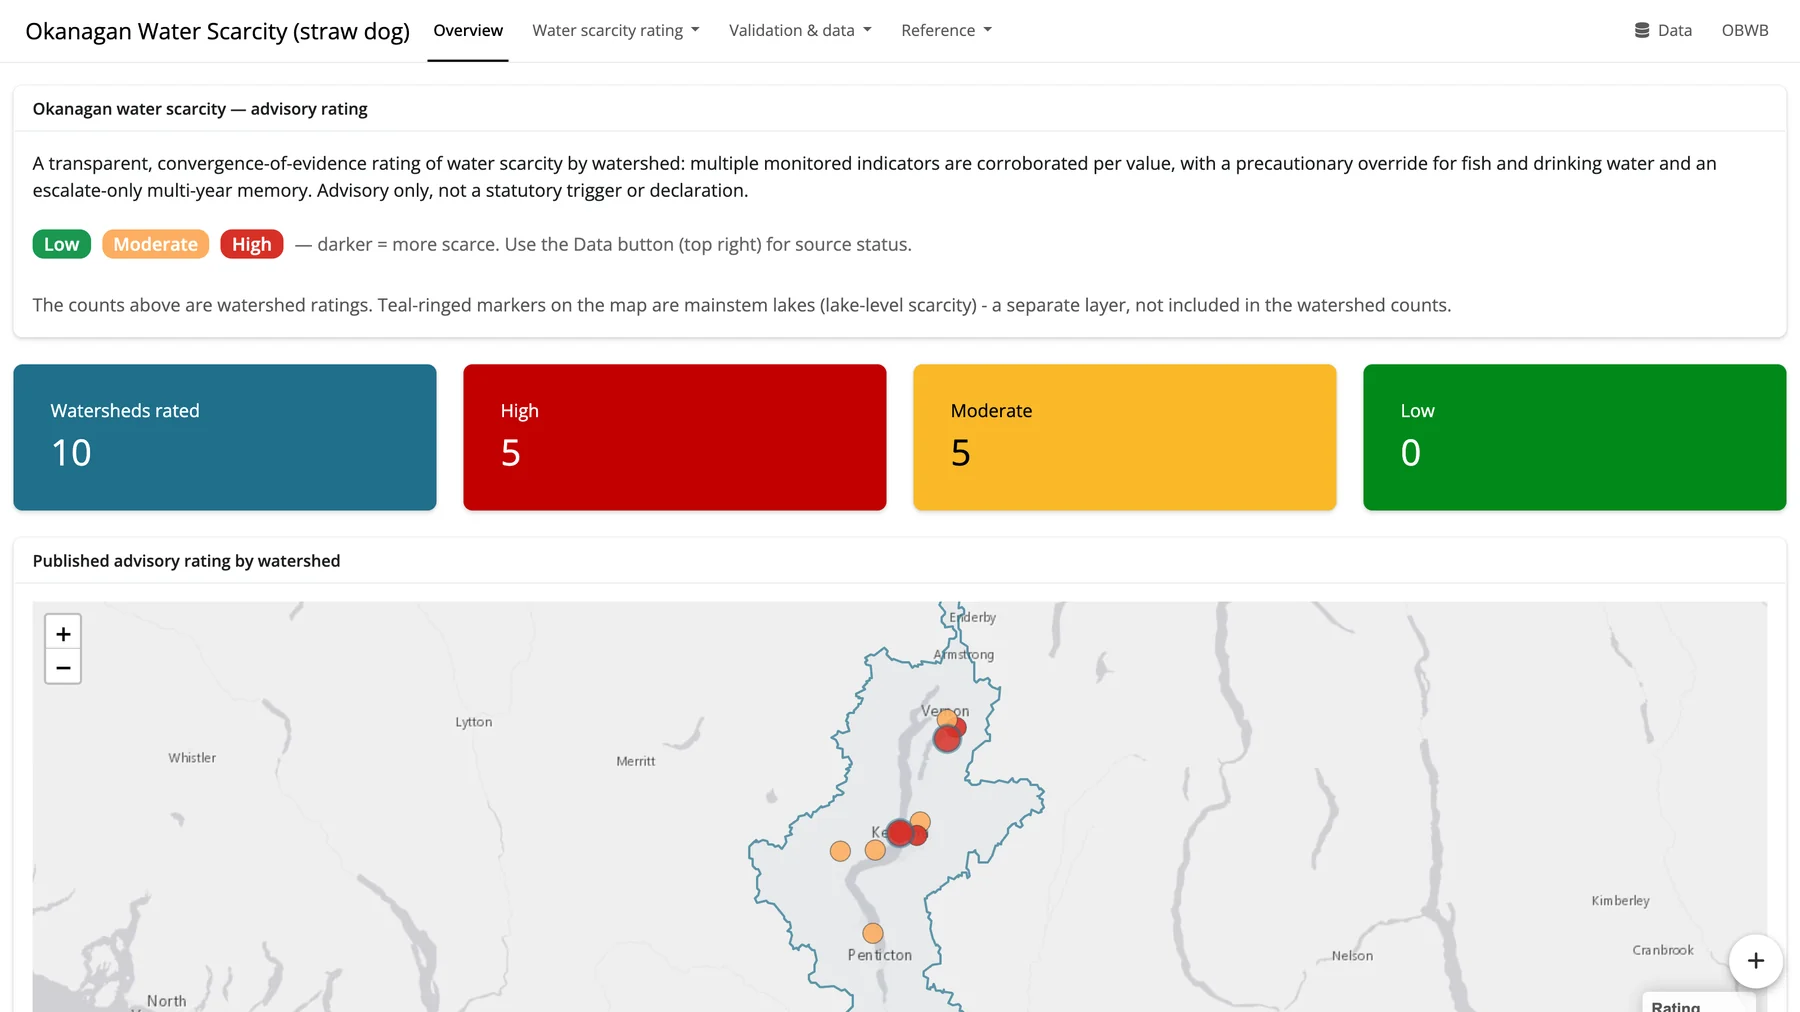
The live decision-support tool behind the ratings: 10 watersheds rated, 5 High, 5 Moderate, 0 Low. Ratings combine several monitored indicators with a precautionary override for fish and drinking water. Advisory only, not a statutory trigger or declaration. Login-gated straw dog (OBWB and ONA).
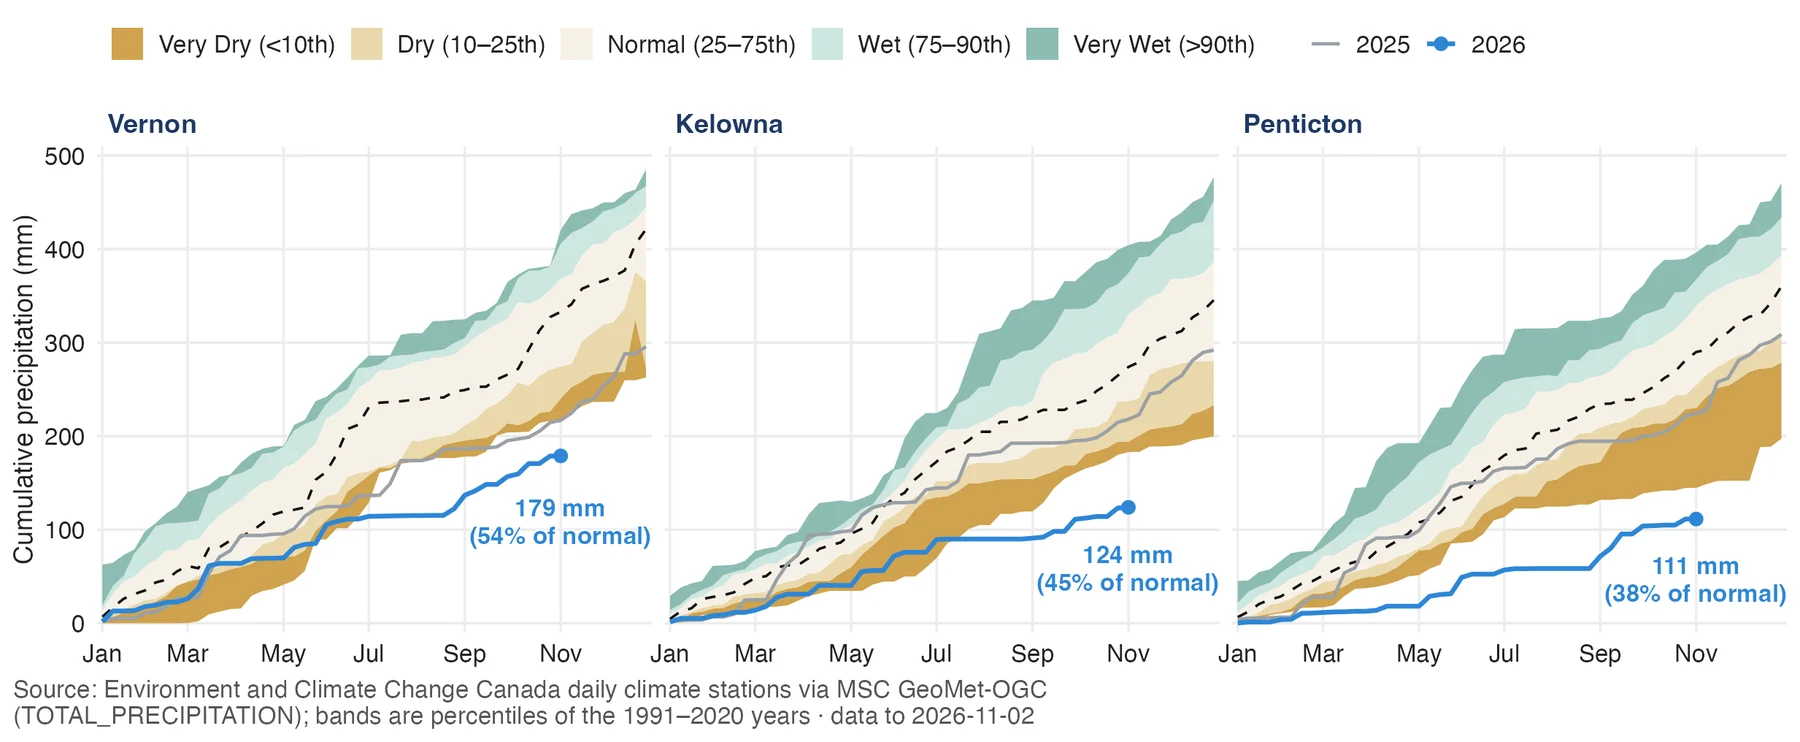
Calendar-year precipitation against 1991 to 2020 percentile bands. To 2 November: Vernon 179 mm (54% of normal), Kelowna 124 mm (45%), Penticton 111 mm (38%). The deficit grows from north to south, and the 2026 line sits in or below the driest band at all three stations for most of the year.
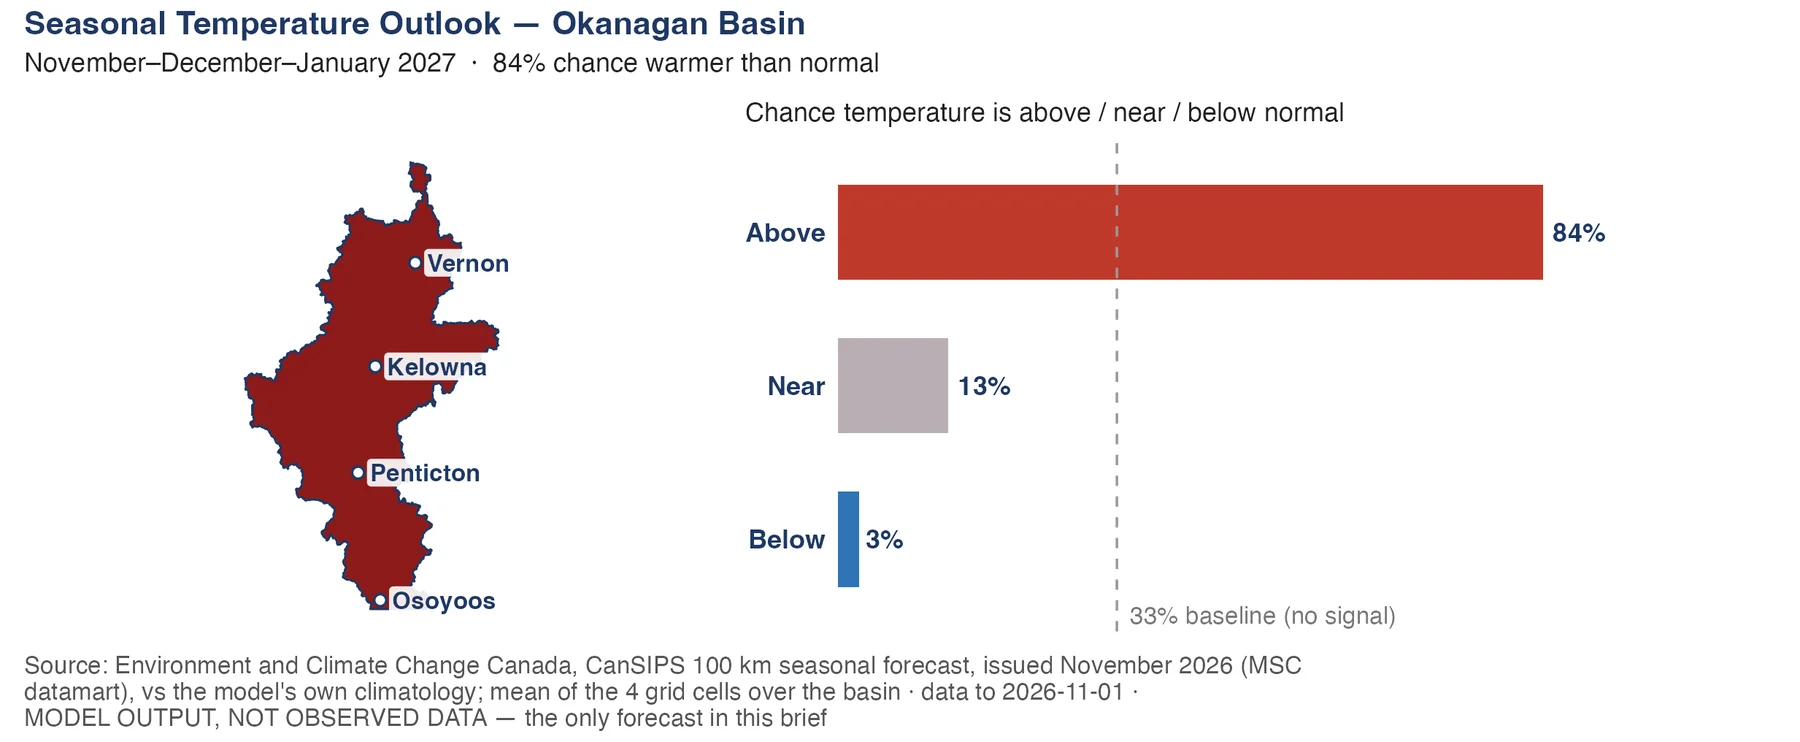
ECCC's CanSIPS outlook for November to January gives the Okanagan an 84% chance of above-normal temperature, 13% near normal and 3% below normal (33% each is no signal). This is model output, not observed data, and it is the only forecast in the brief.
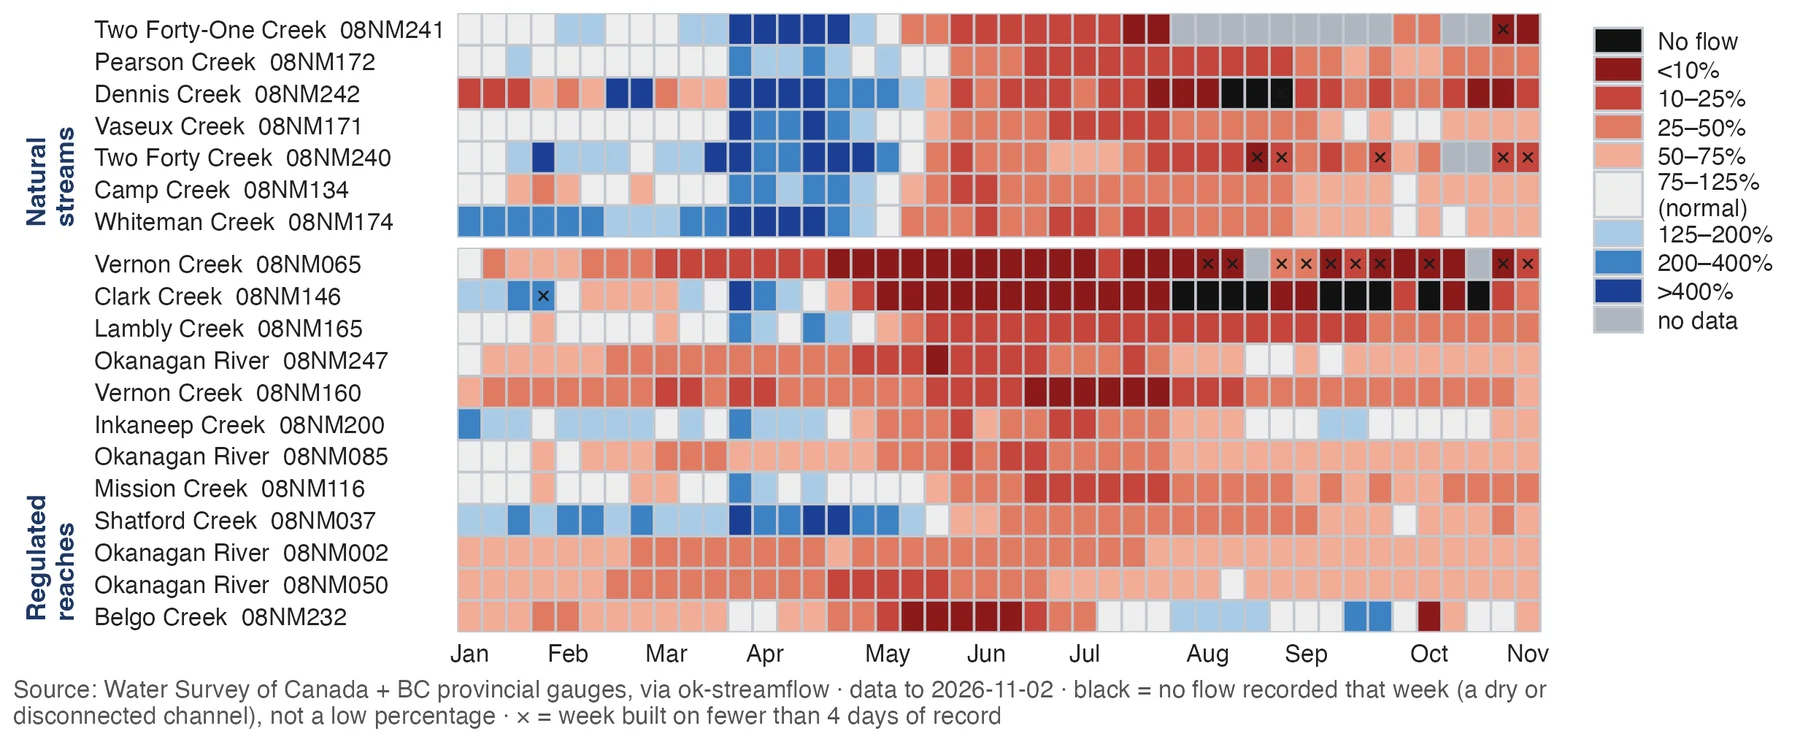
Each cell is one gauge in one week, coloured by flow as a percent of normal. Natural streams sit above; regulated reaches below. Most gauges turned red in May and stayed there. Black cells are weeks with no flow recorded. In the week of 29 Oct to 4 Nov, all 19 reporting gauges were below 75% of normal.
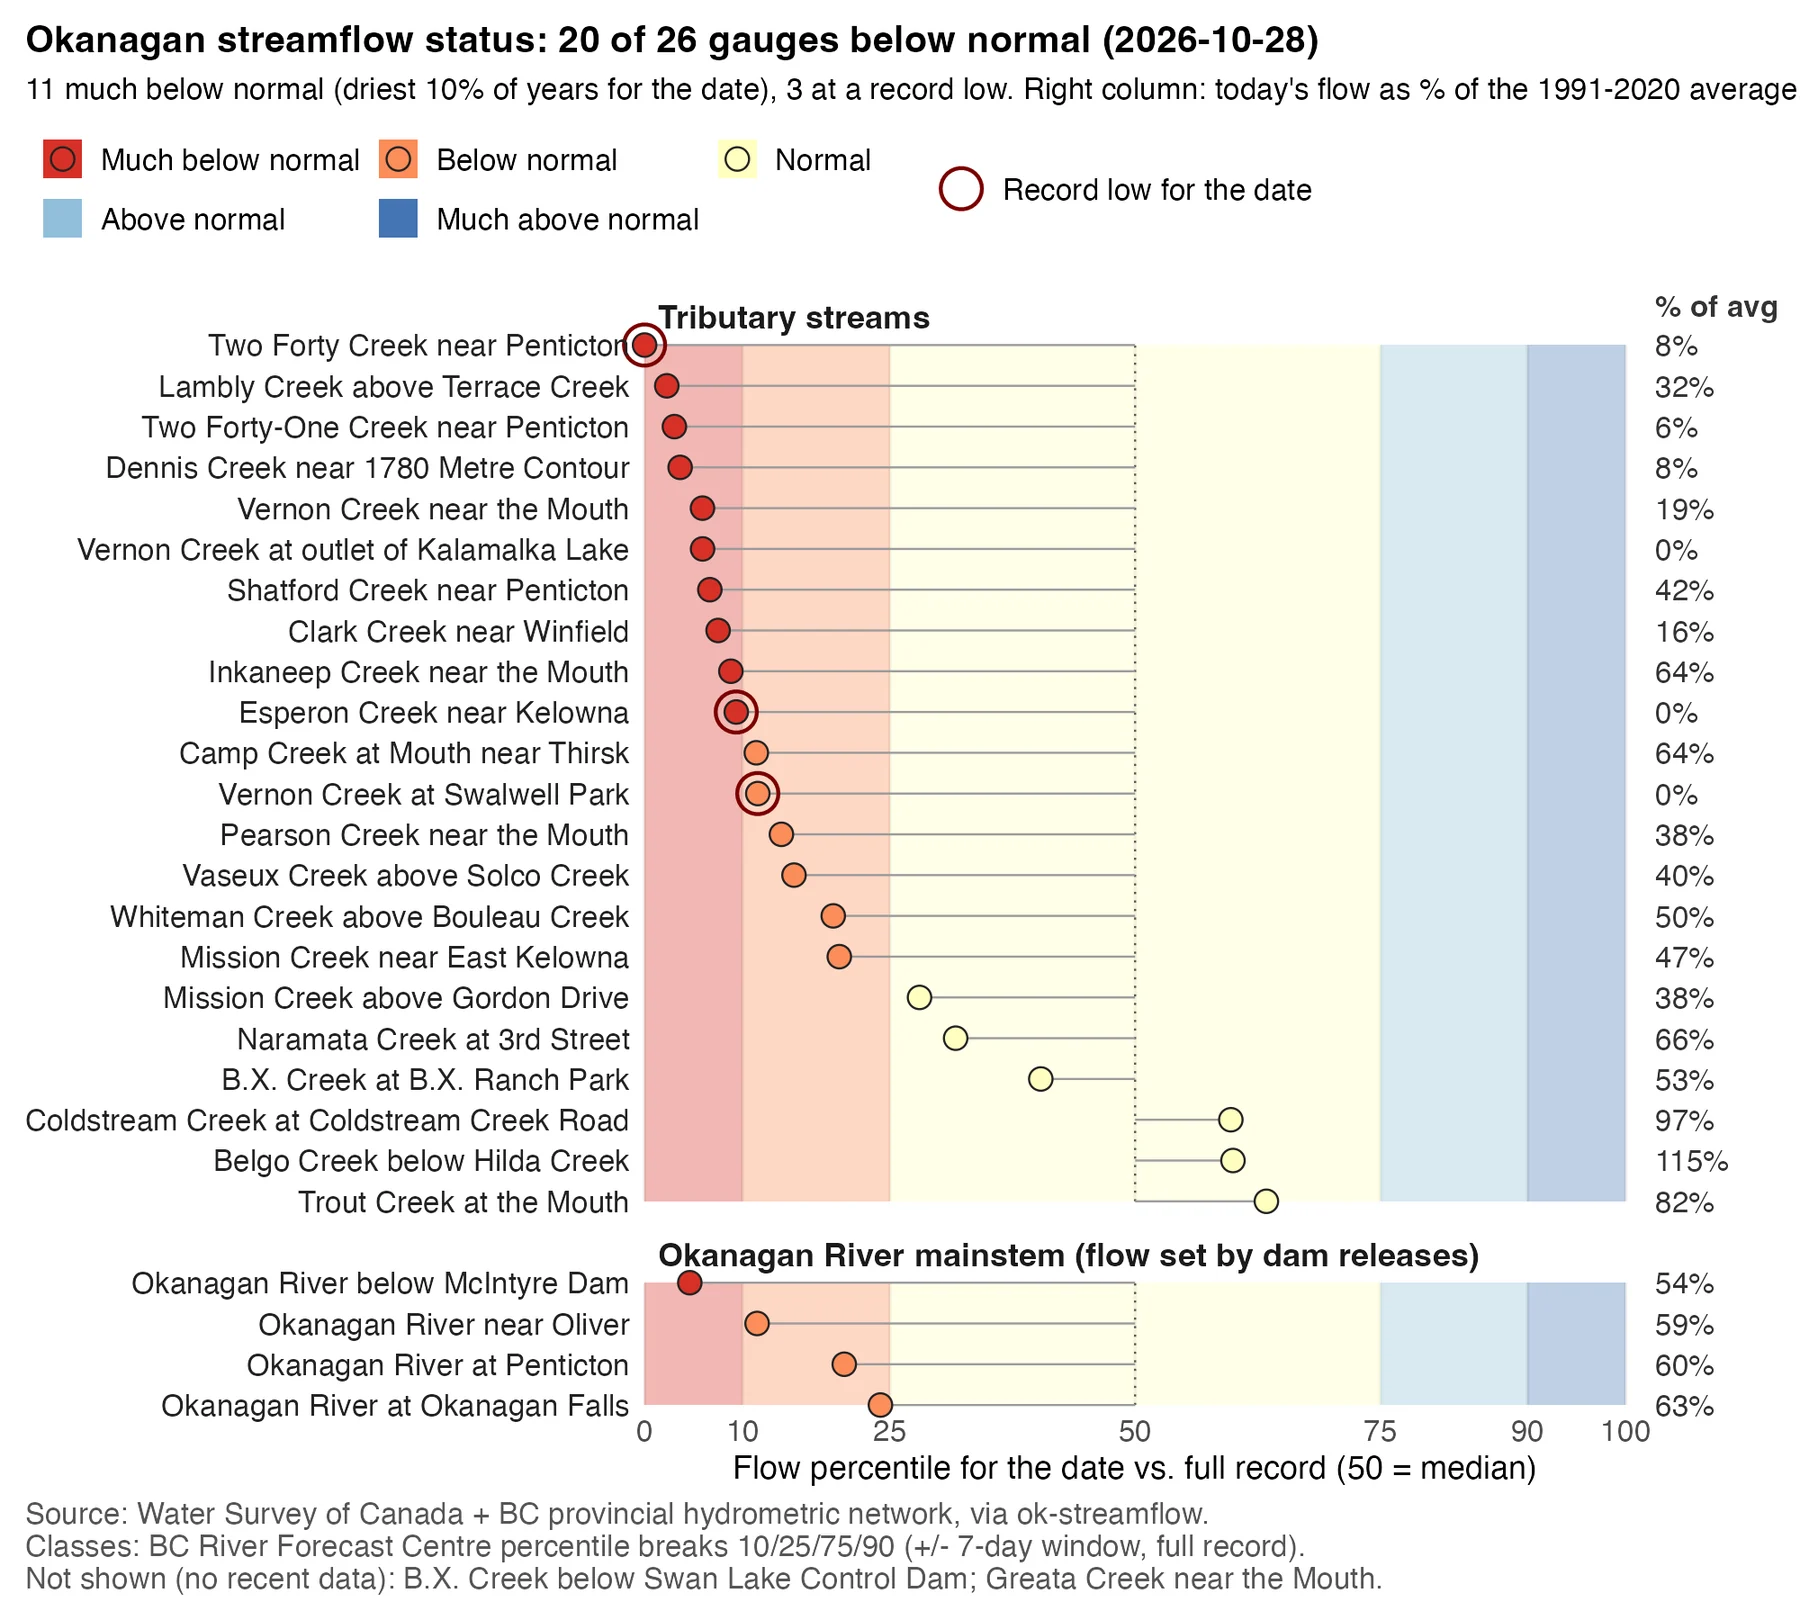
Today's flow at each gauge ranked against its full record for the date. 20 of 26 gauges are below normal, 11 much below normal (driest 10% of years), and 3 are at a record low for the date. The right column gives flow as a percent of the 1991 to 2020 average.
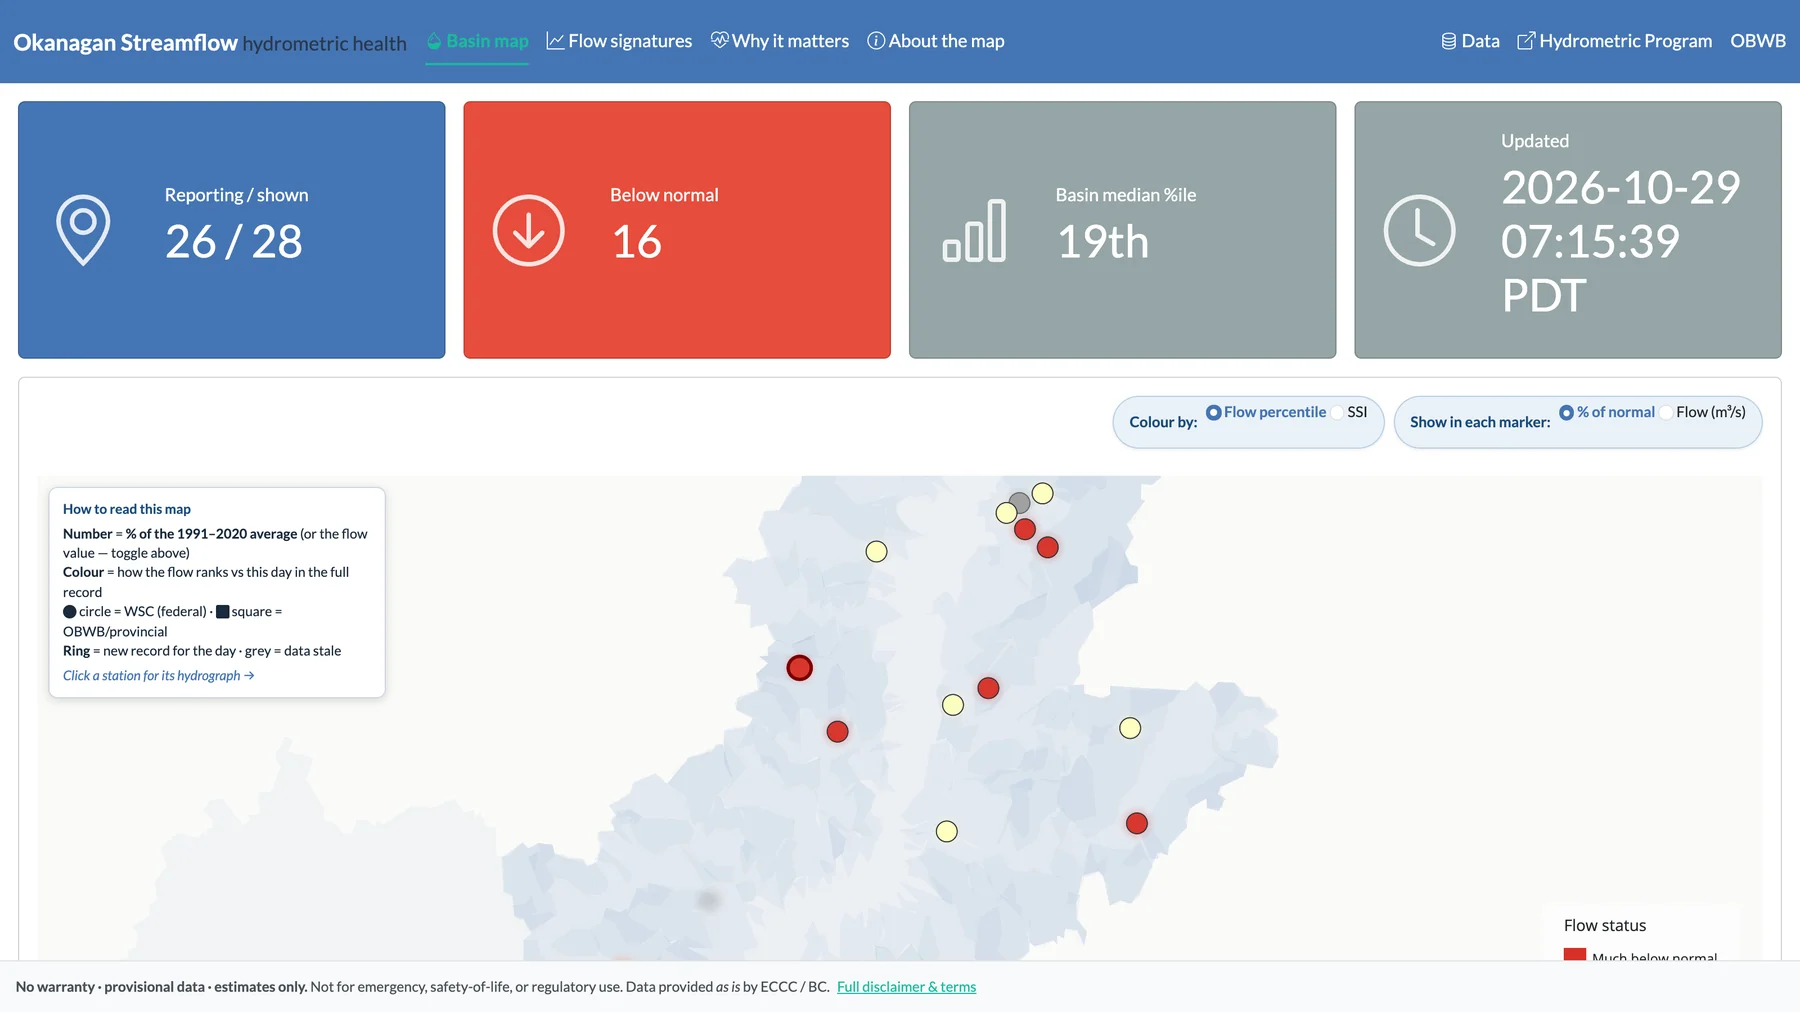
The public streamflow app: 26 of 28 stations reporting, 16 below normal, basin median at the 19th percentile. Marker colour is today's flow percentile; a ring marks a new record for the day. Click any station for its hydrograph.
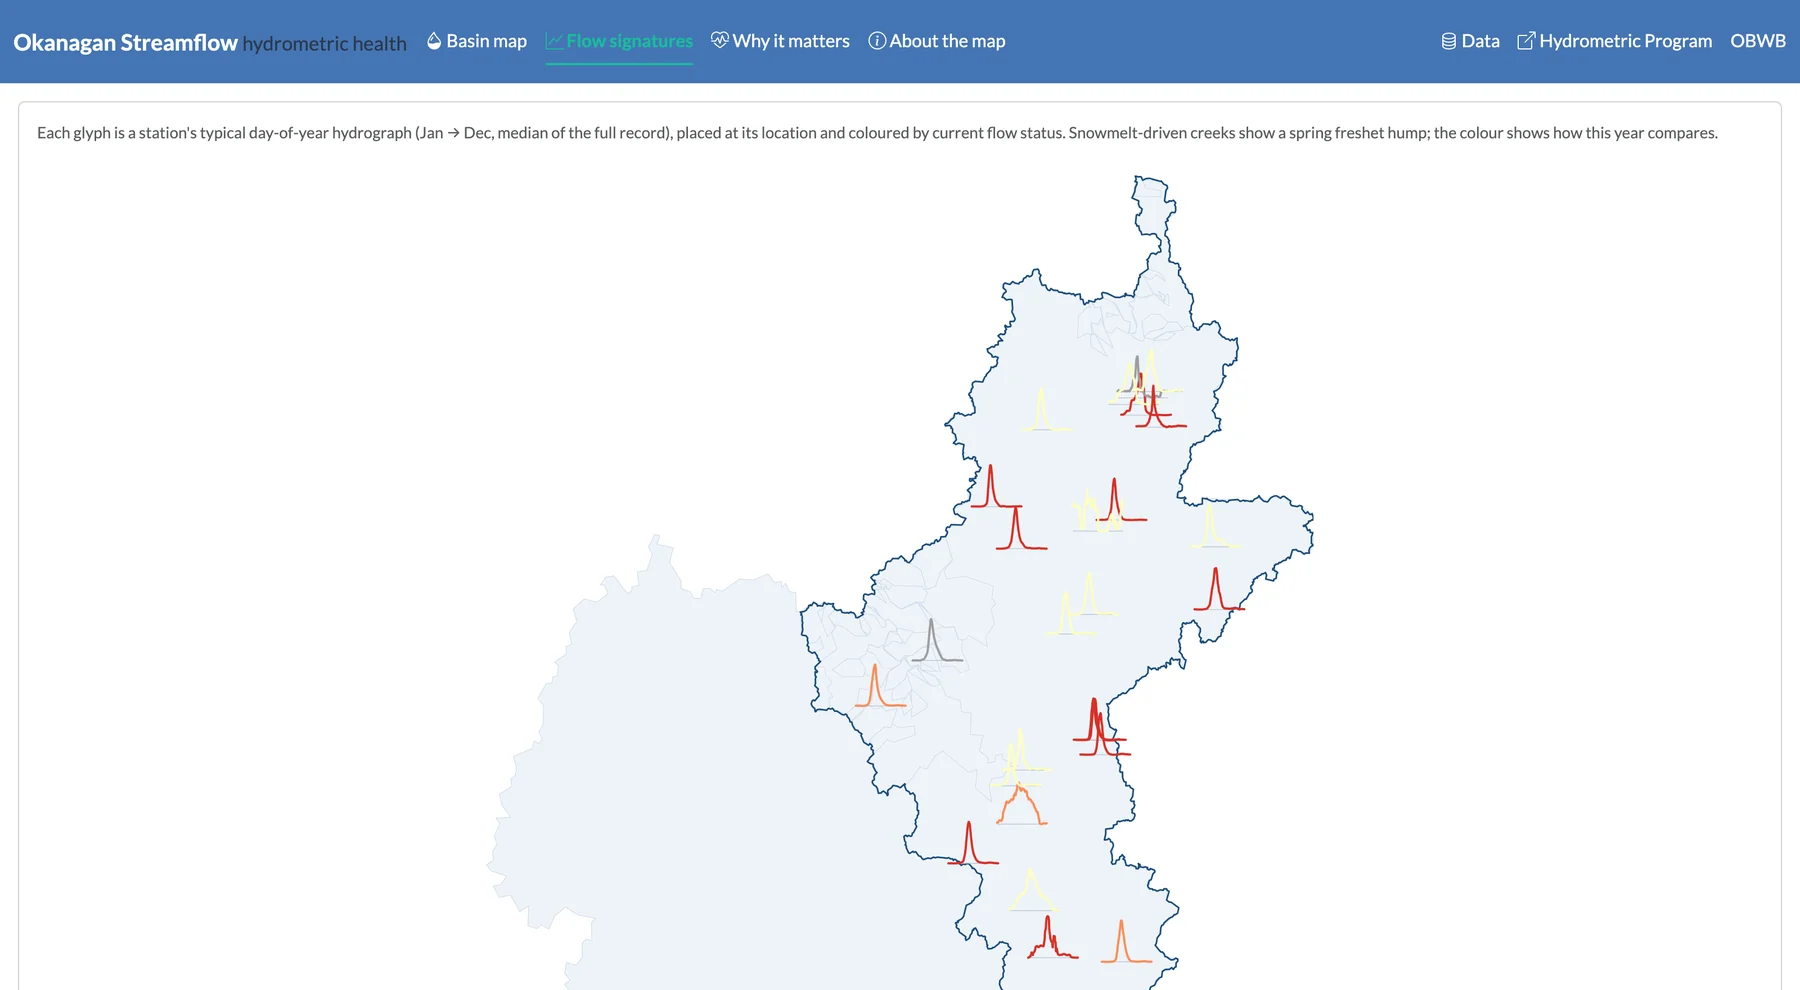
Each glyph is a station's typical annual hydrograph (January to December, median of its full record), placed at its location and coloured by current flow status. Snowmelt-driven creeks show a spring freshet hump; the colour shows how this year compares.
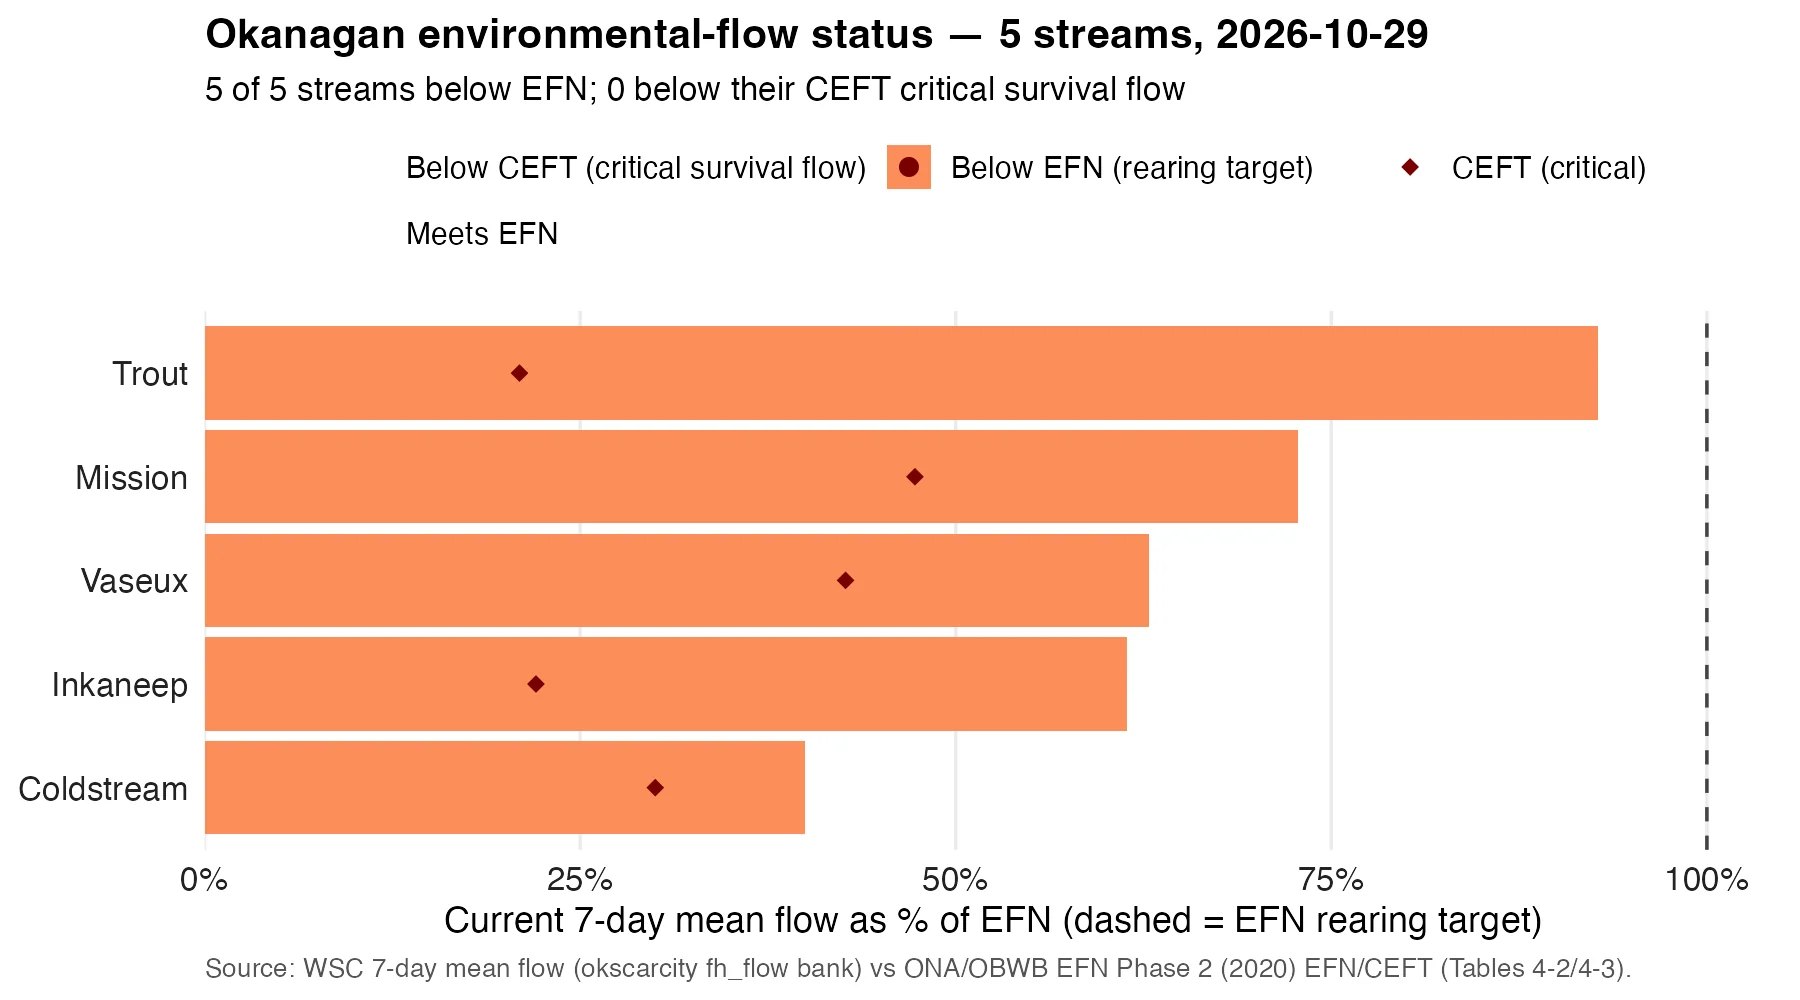
Current 7-day mean flow as a percent of the environmental flow need (EFN, rearing target). All five streams with an EFN are below it: Trout, Mission, Vaseux, Inkaneep and Coldstream. None is below the critical environmental flow threshold (CEFT, critical survival flow).
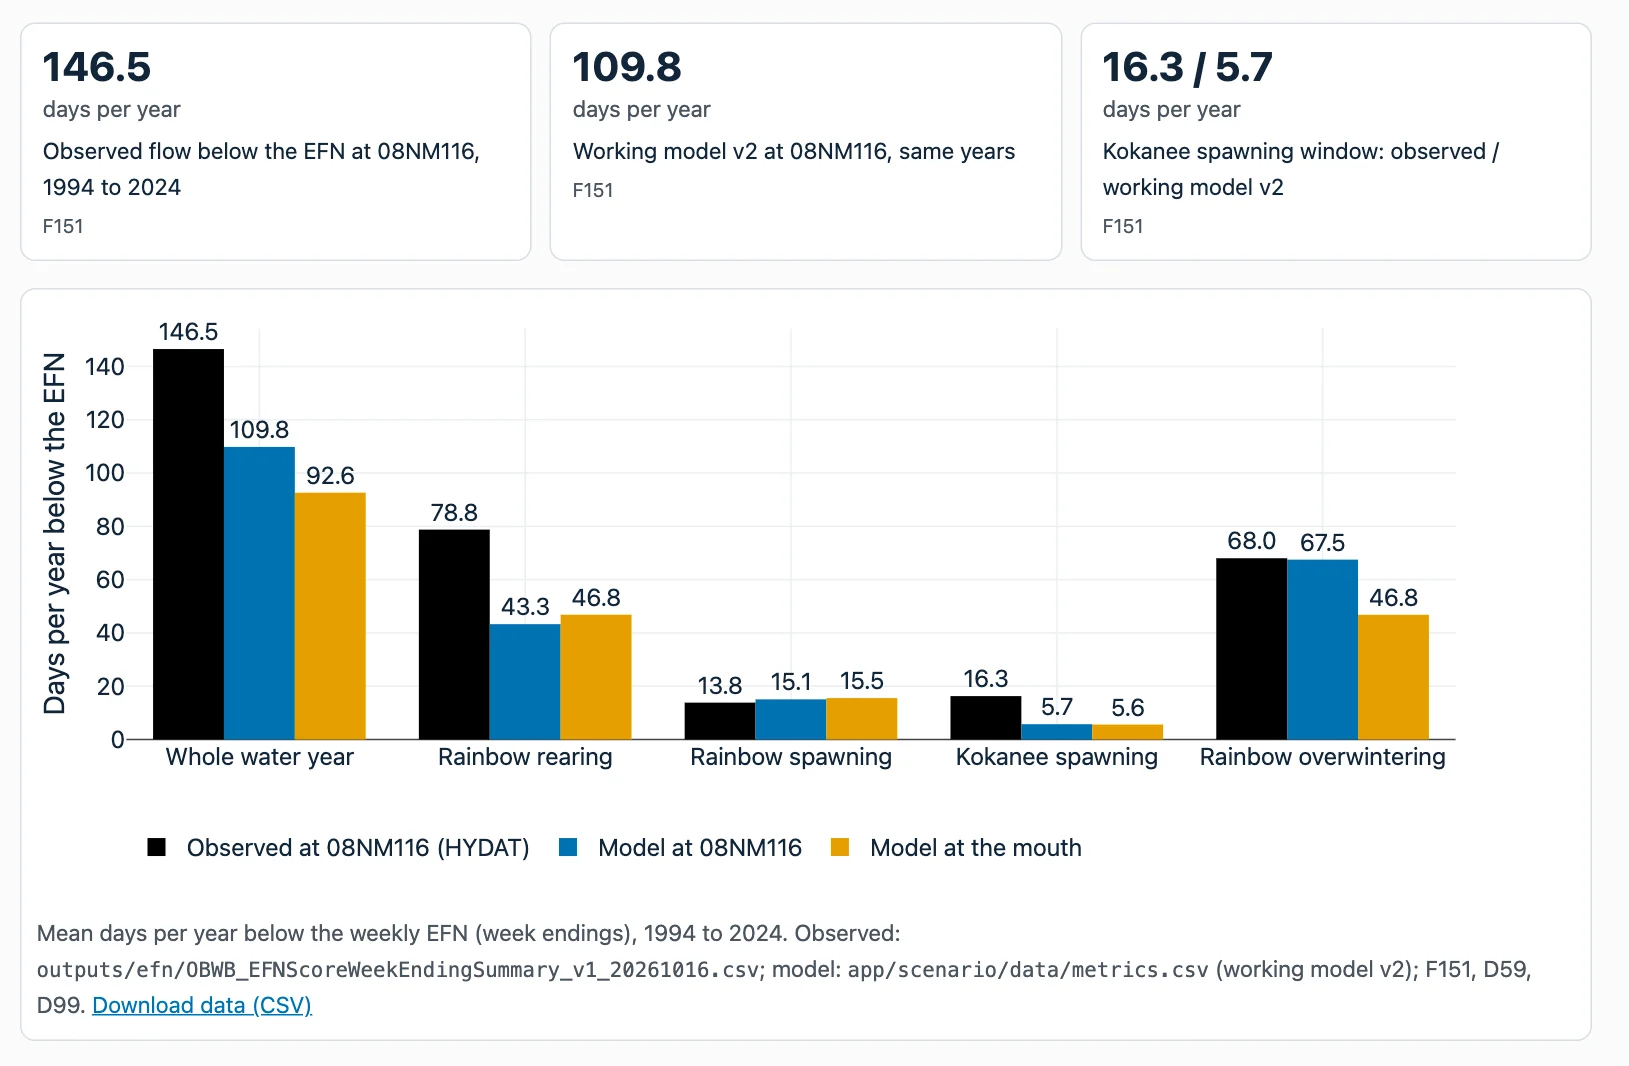
At gauge 08NM116, observed flow was below the EFN on 146.5 days per year on average, 1994 to 2024. The working watershed model gives 109.8 days, so it undercounts low-flow days. Bars split the count by life stage. DRAFT model results: not for decisions.
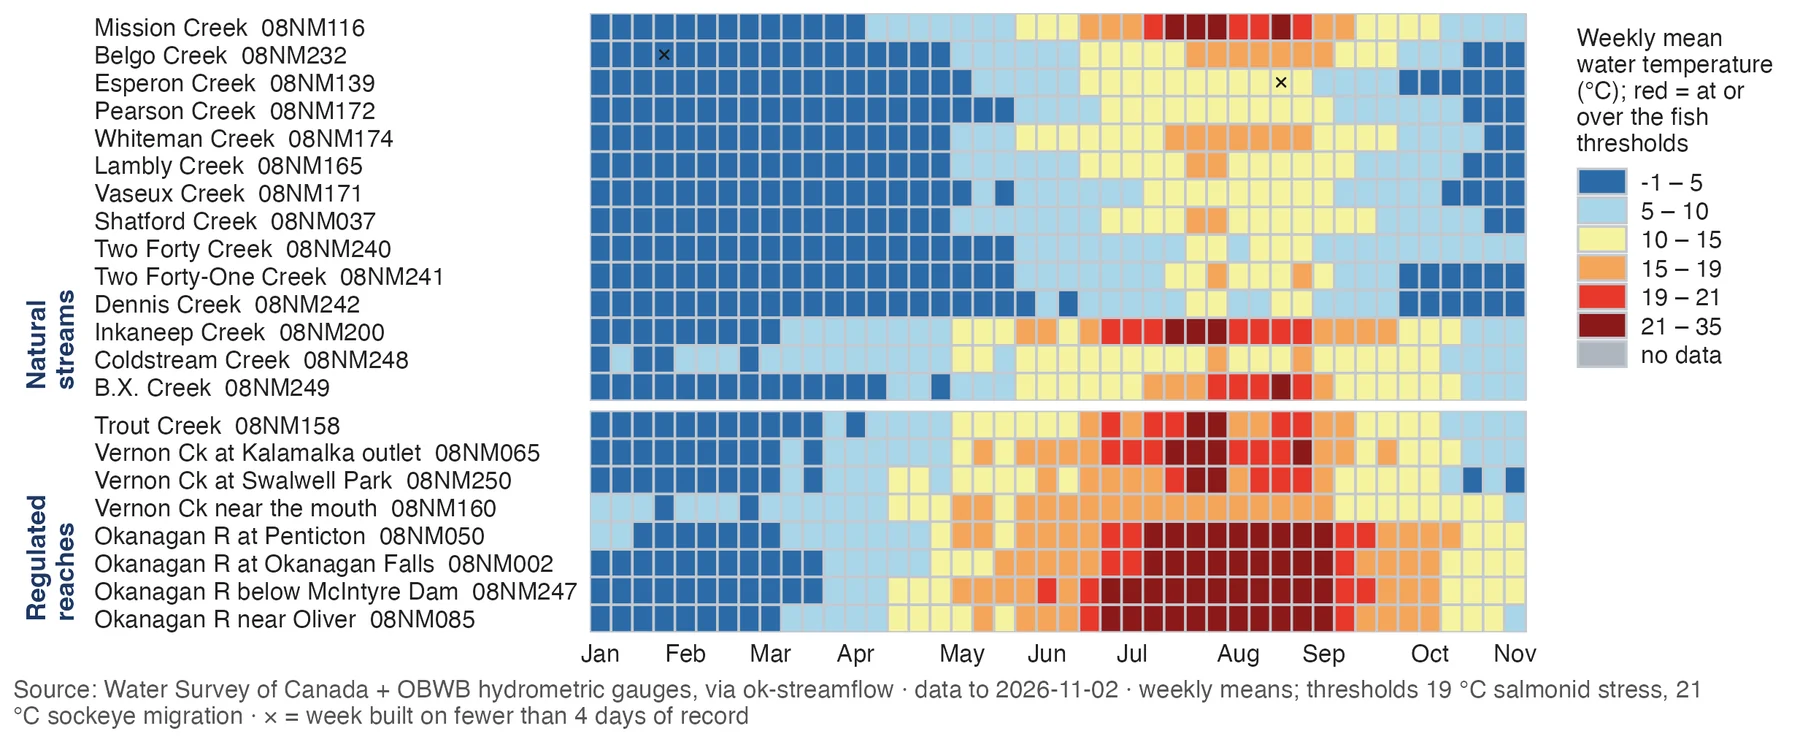
Each cell is one gauge in one week, coloured by weekly mean temperature against two thresholds: 19 °C (salmonid stress, BC WQG) and 21 °C (Okanagan sockeye migration). The Okanagan River mainstem sat in the top bands through July and August. Across 22 gauges, 99 gauge-weeks reached 19 °C or more in 2026; none is above 19 °C now.
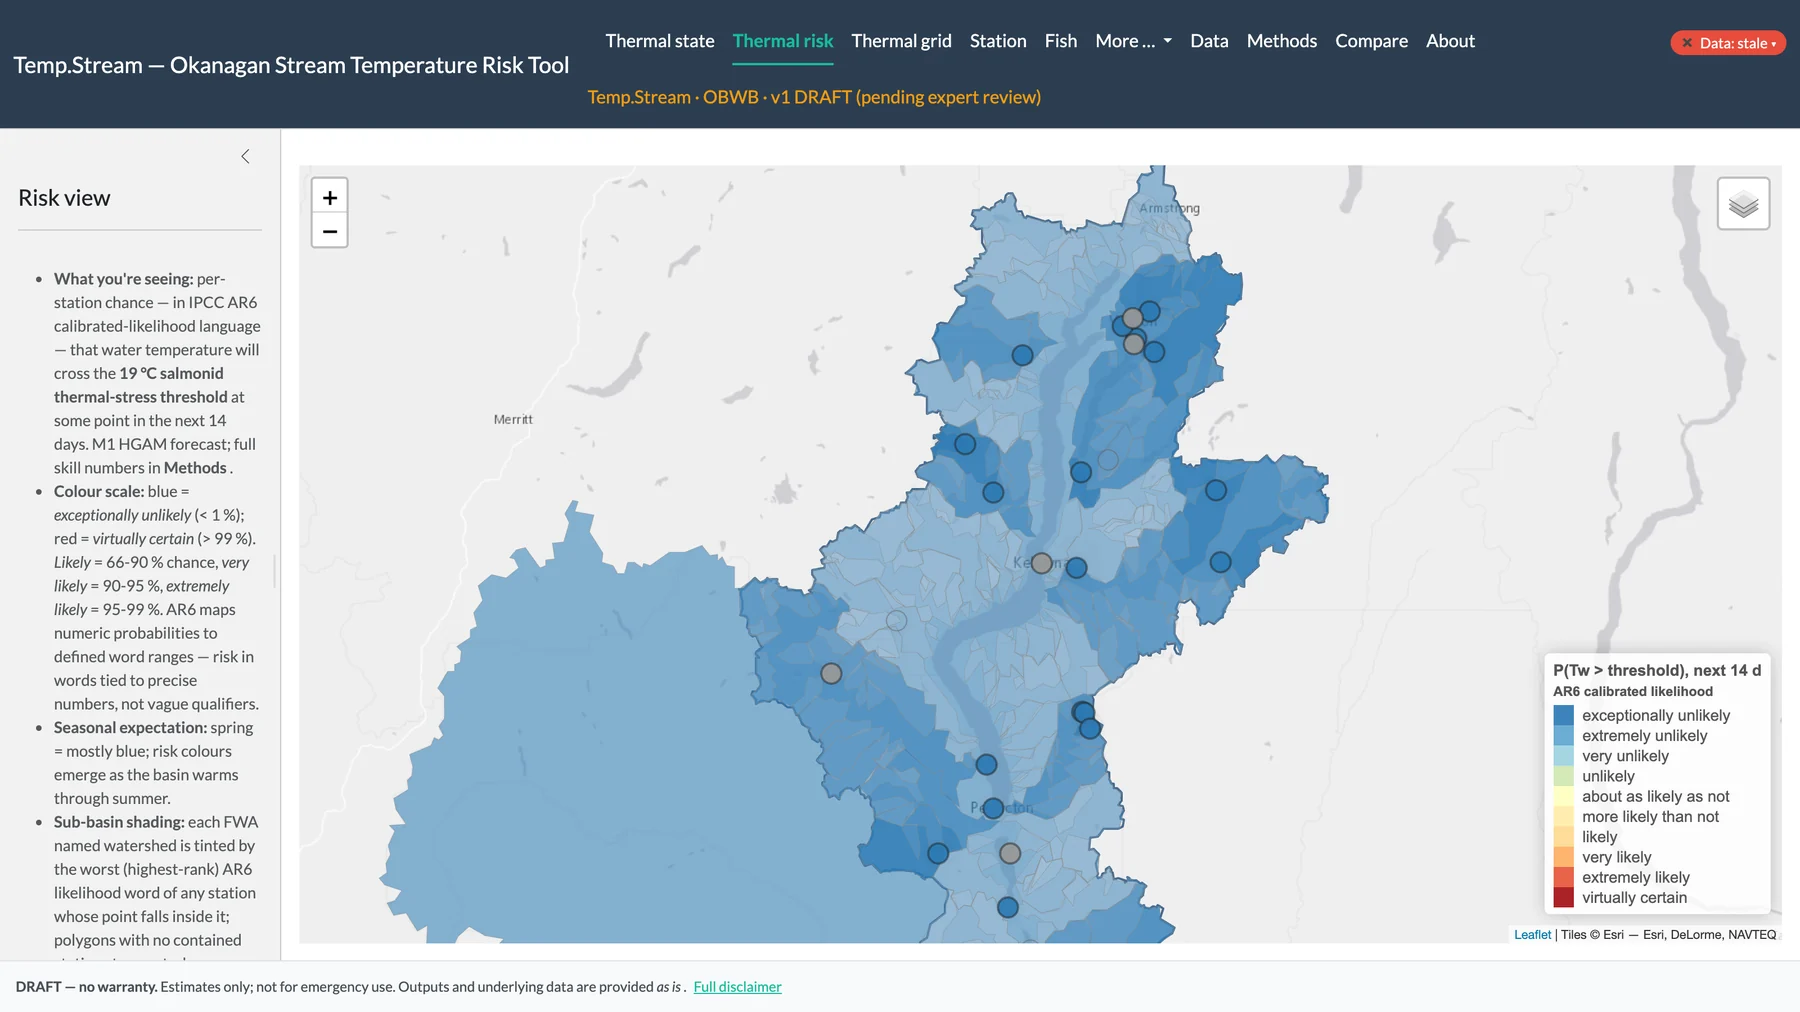
Each station and sub-basin is coloured by the calibrated likelihood (IPCC AR6 terms) that water temperature crosses 19 °C at some point in the next 14 days. In early November the basin is in the blue, unlikely range. The same map runs red in summer. Model output, v1 draft pending expert review.
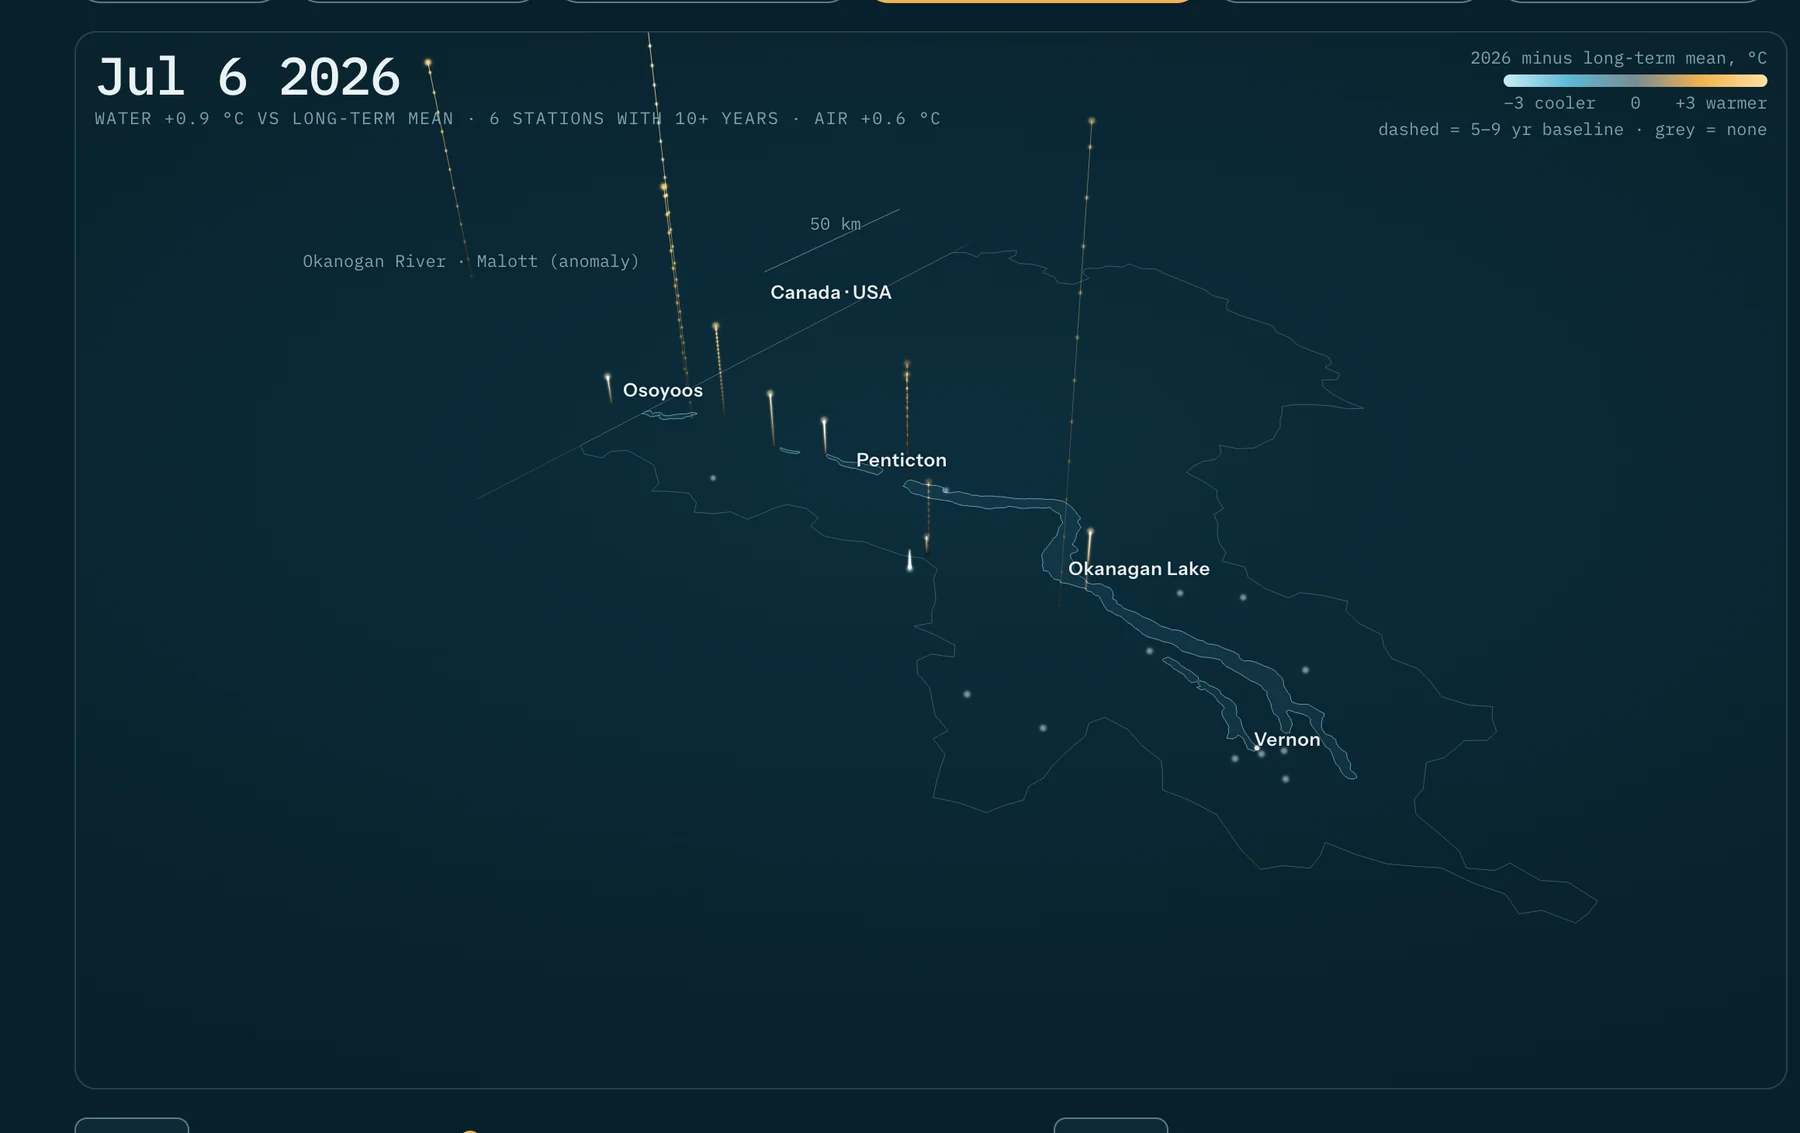
A 3D scene that steps week by week through June to September 2026 at 24 stations, comparing each week with that station's long-term mean since 2002. The frame shown is 6 July. Air-temperature anomaly is shown beside the water anomaly.
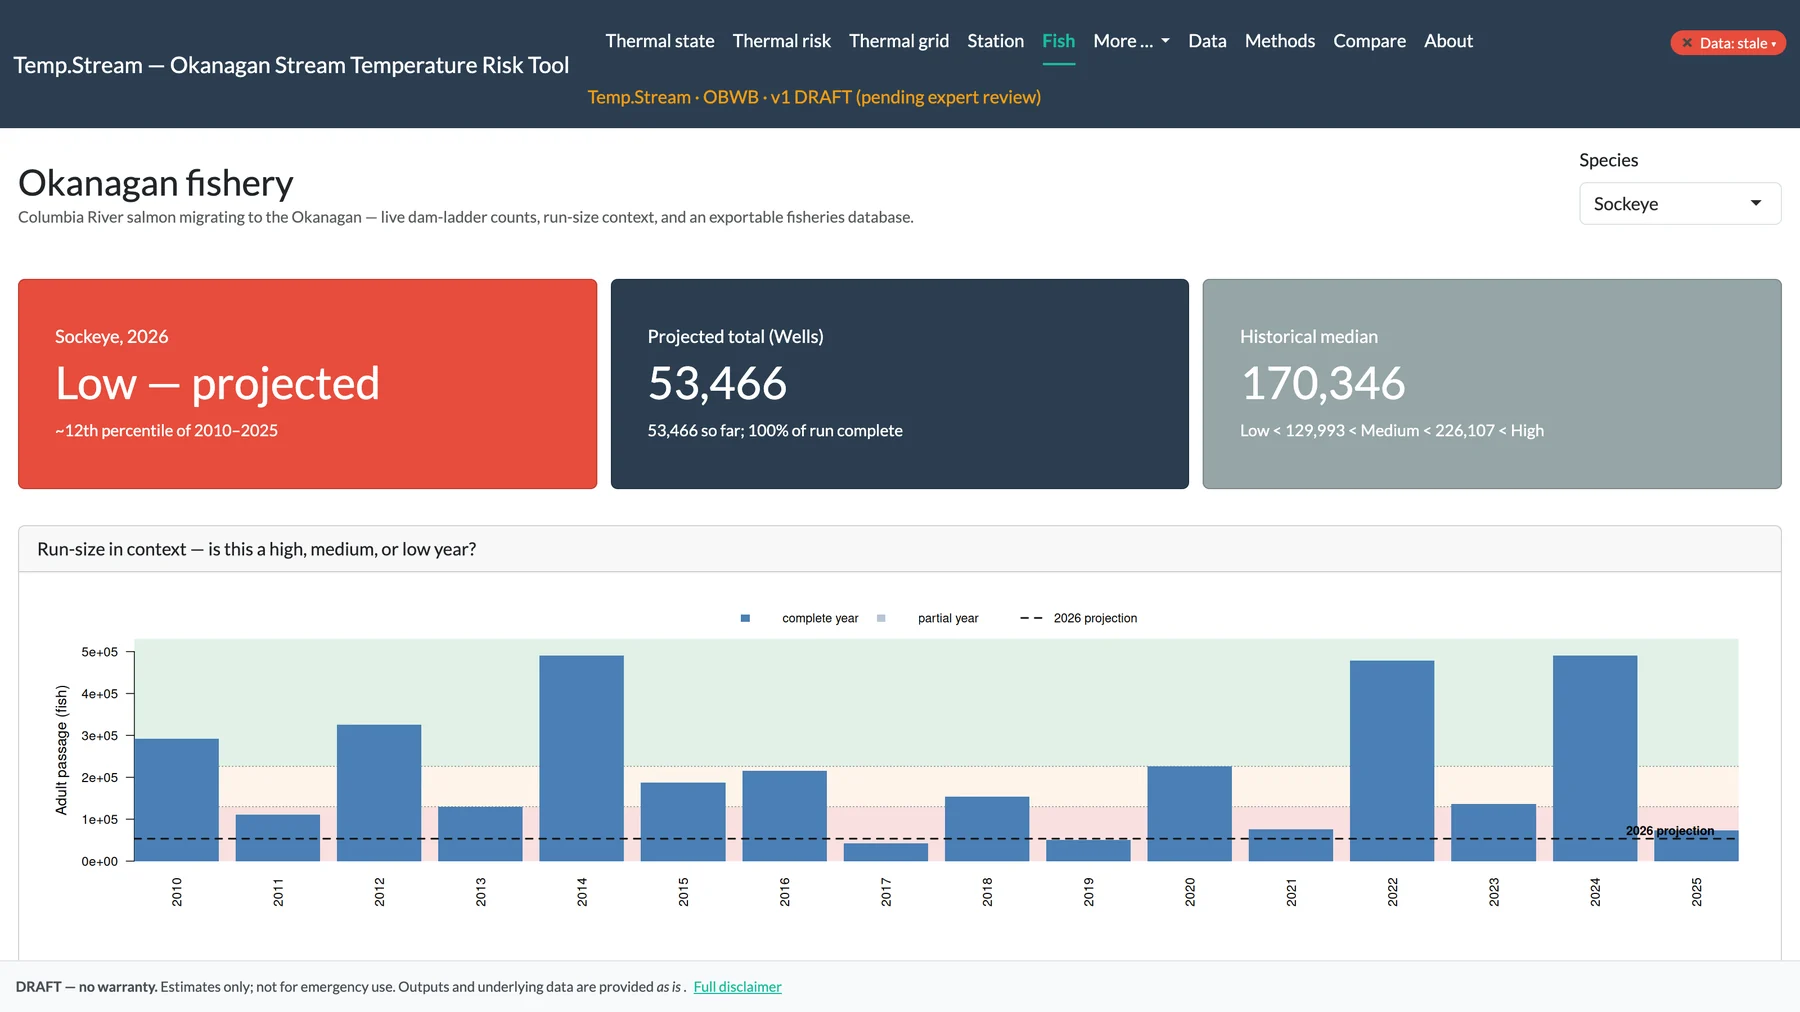
Sockeye counted at Wells Dam: 53,466 in 2026 with the run complete, against a 2010 to 2025 median of 170,346. Classed Low, about the 12th percentile of 2010 to 2025. Bars put 2026 in context with each year since 2010.
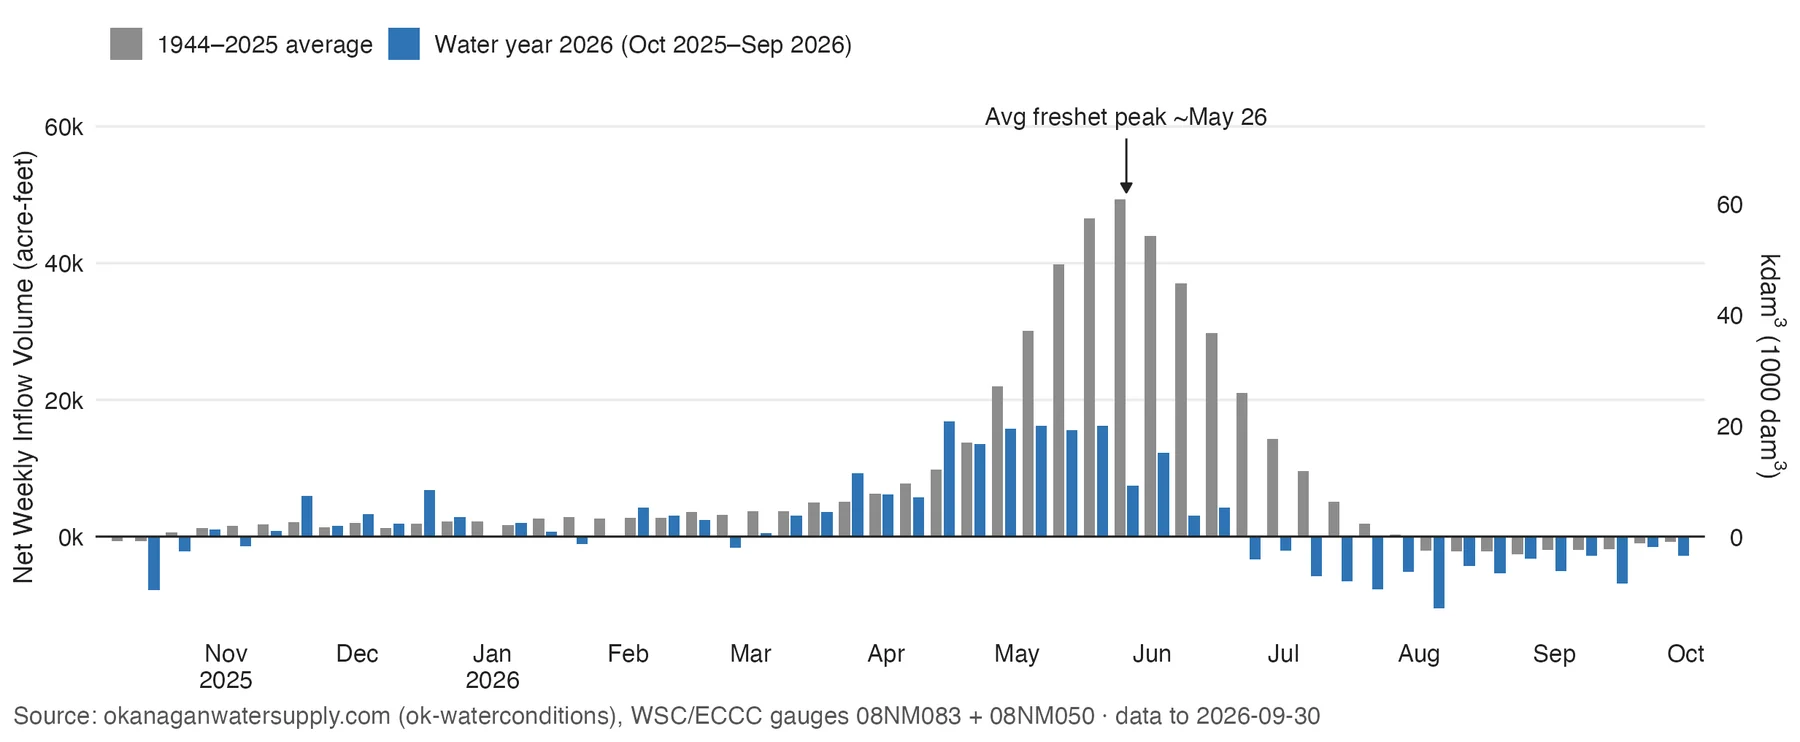
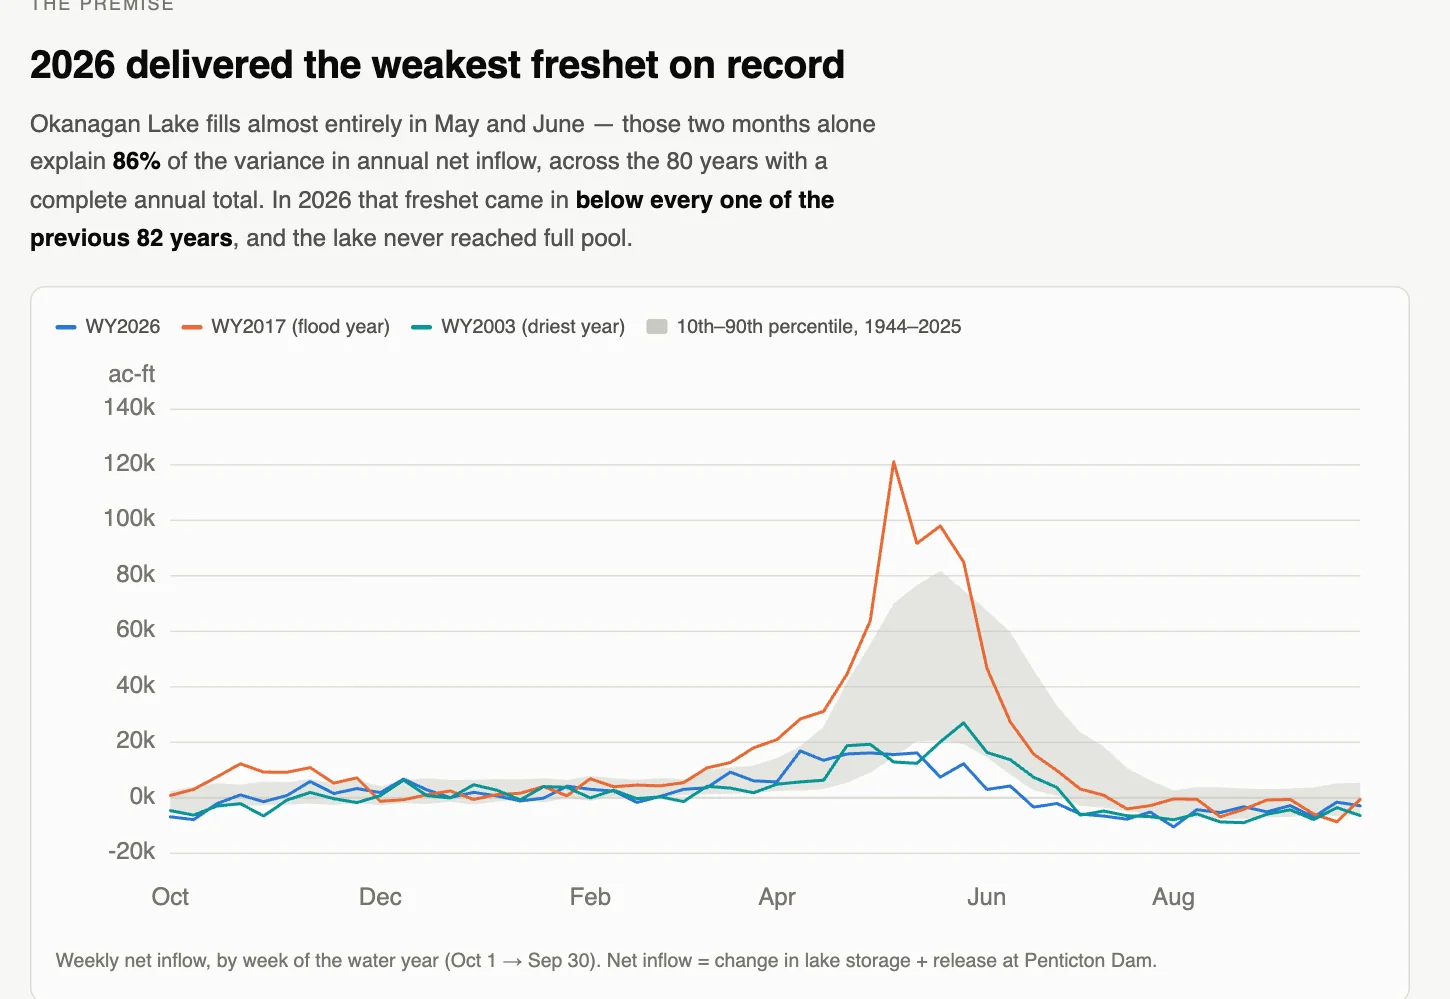
Weekly net inflow, October 2025 to September 2026, against the 1944 to 2025 average. The 2026 freshet peaked at about 16,000 to 17,000 acre-feet a week, against an average peak near 49,000. Net inflow turned negative at the end of June; in an average year that happens in August.
Platform
Okanagan Drought Data (weekly drought brief), archive
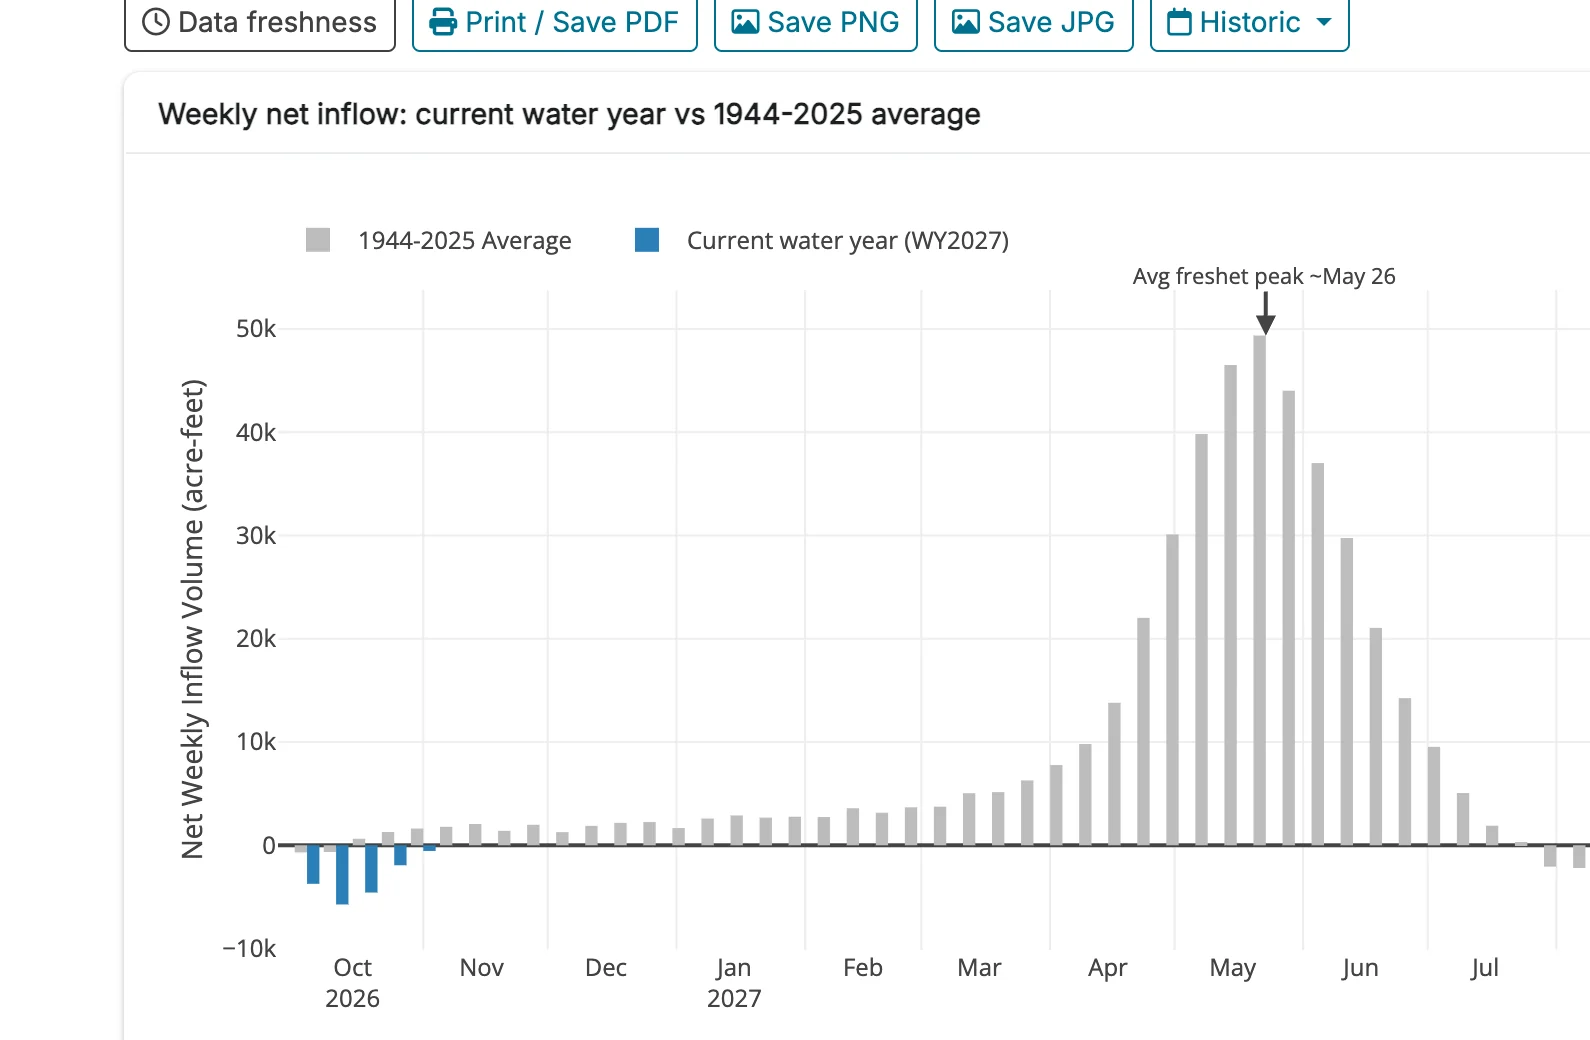
The public water-conditions site tracks net inflow each week against the 1944 to 2025 average. Water year 2027 began on 1 October with net inflow below zero: the lake is still drawing down. A Historic menu shows each past water year the same way.
May to June net inflow was 69,592 acre-feet, the lowest of 83 years (next lowest: 1992, 77,756). Those two months explain 86% of the variance in annual net inflow. The lake never reached full pool and sat 1.15 m below it on 1 November.
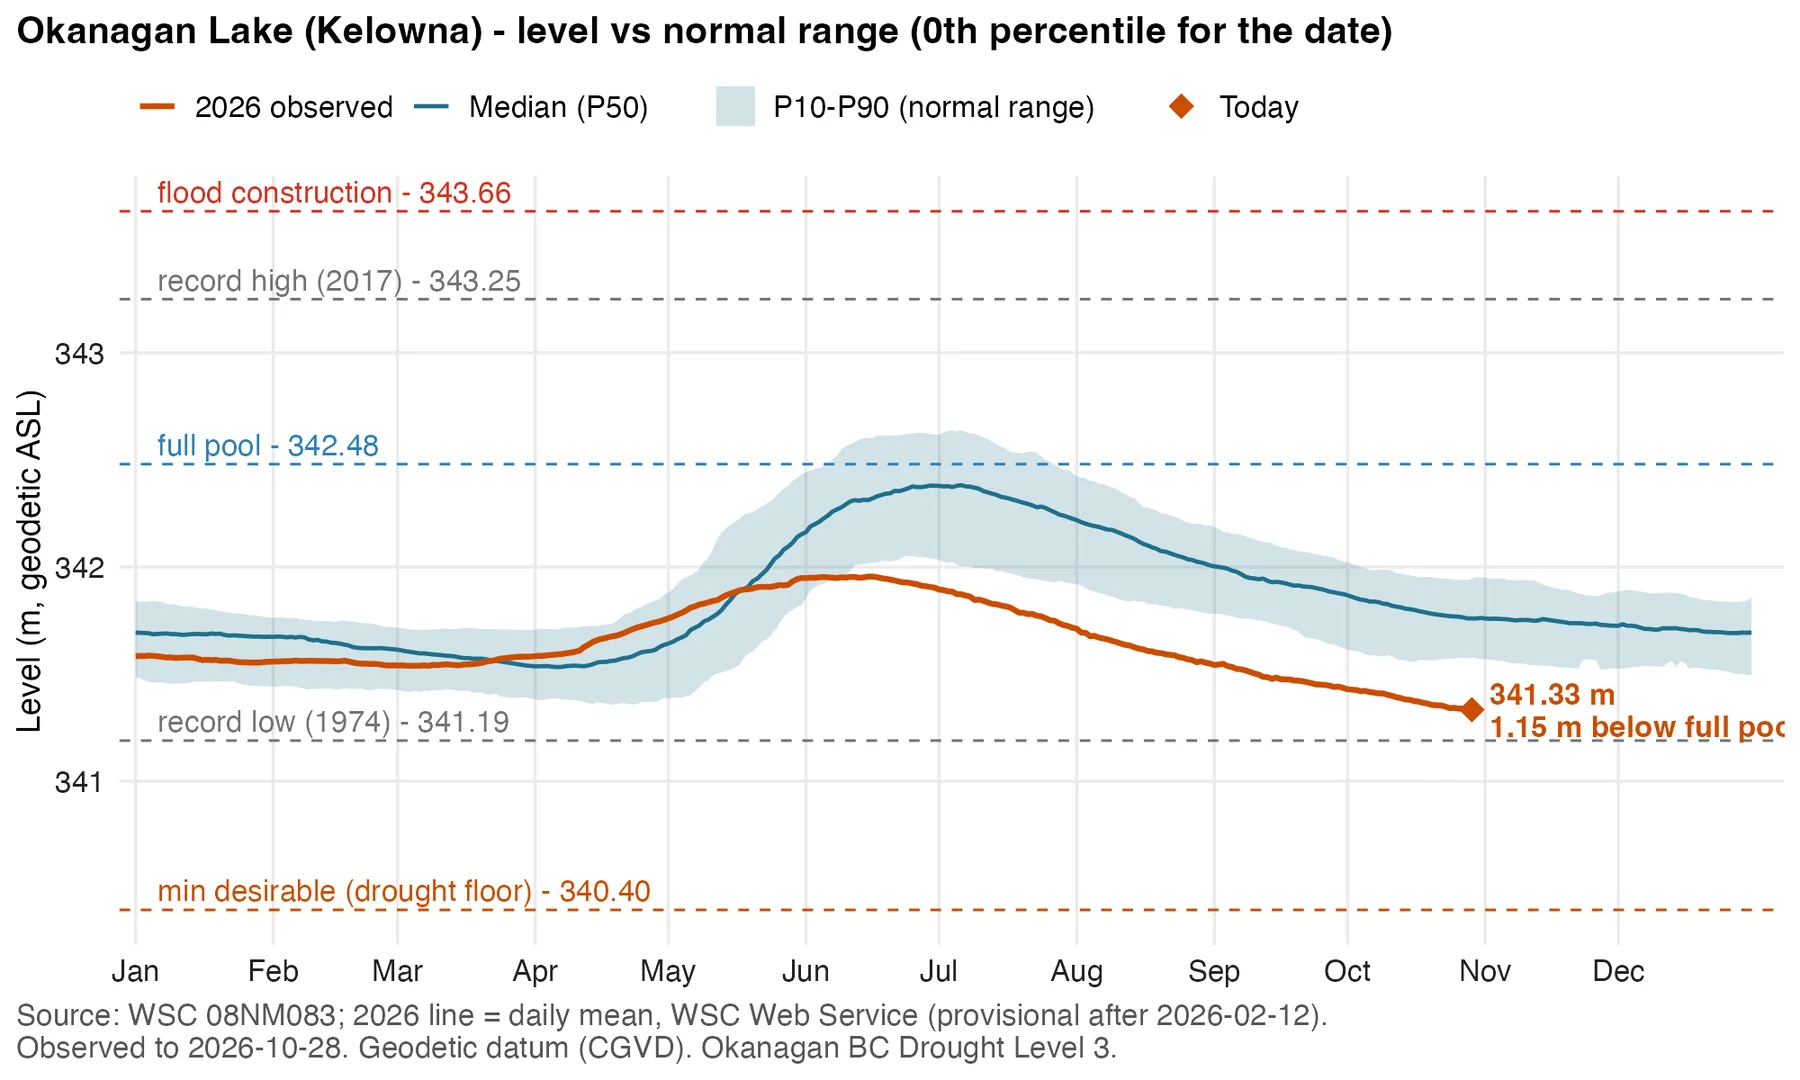
Daily level at Kelowna against the 10th to 90th percentile band and median, with flood, full-pool, record-low and drought-floor lines. 2026 stayed below the median from May on. On 28 October the lake was at 341.33 m, 1.15 m below full pool and at the 0th percentile for the date.
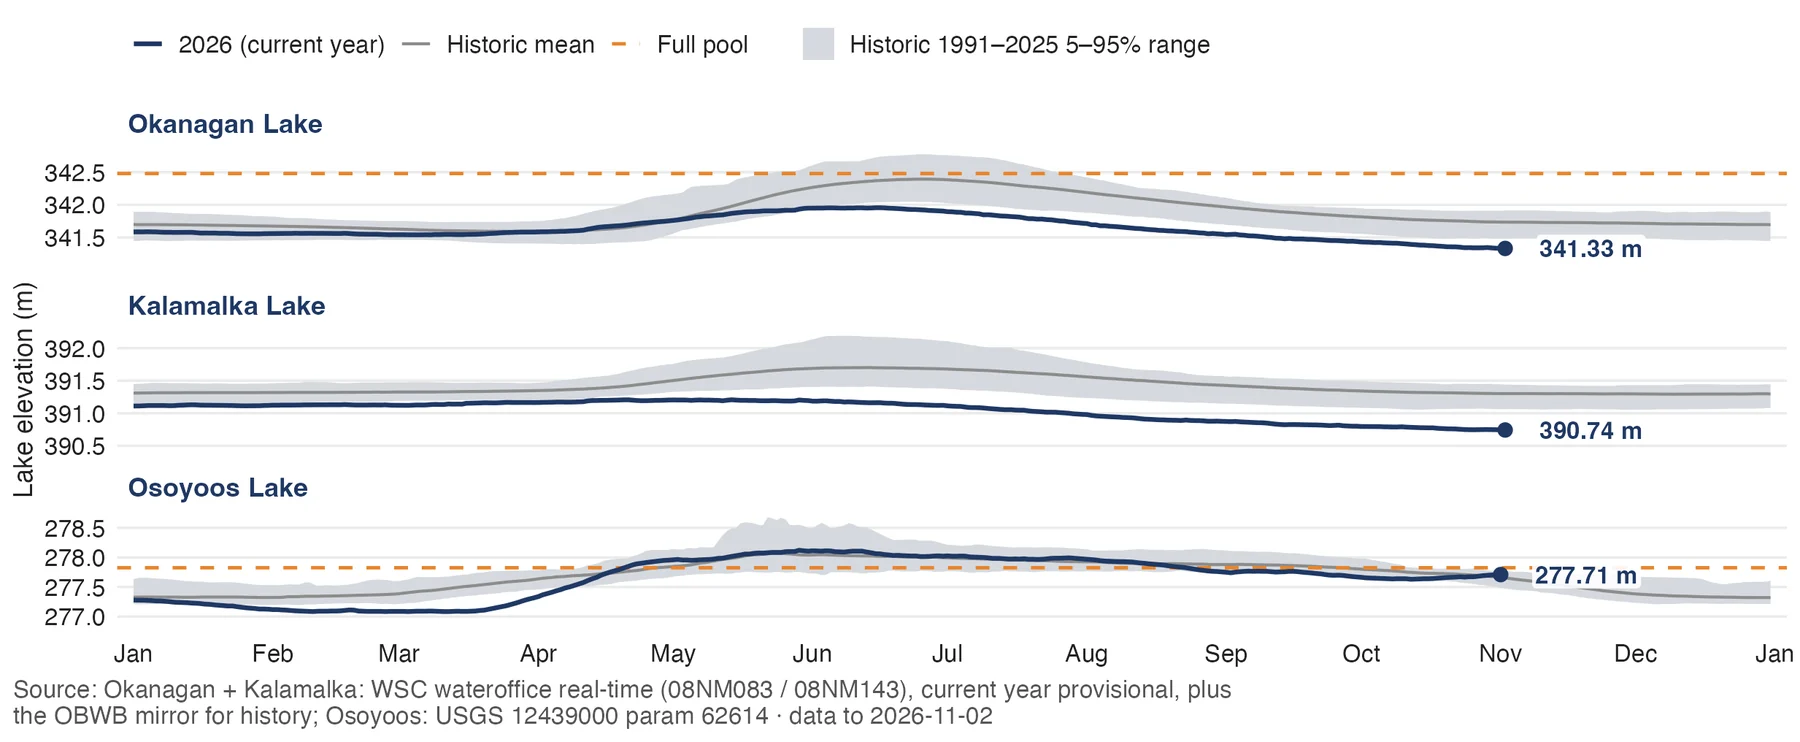
Okanagan Lake 341.33 m, Kalamalka Lake 390.74 m, Osoyoos Lake 277.71 m, each against its historic mean, 1991 to 2025 range and full pool. The brief reports Okanagan Lake lower than any October in the WSC record since 1943 (previous October low 341.39 m, 2003).
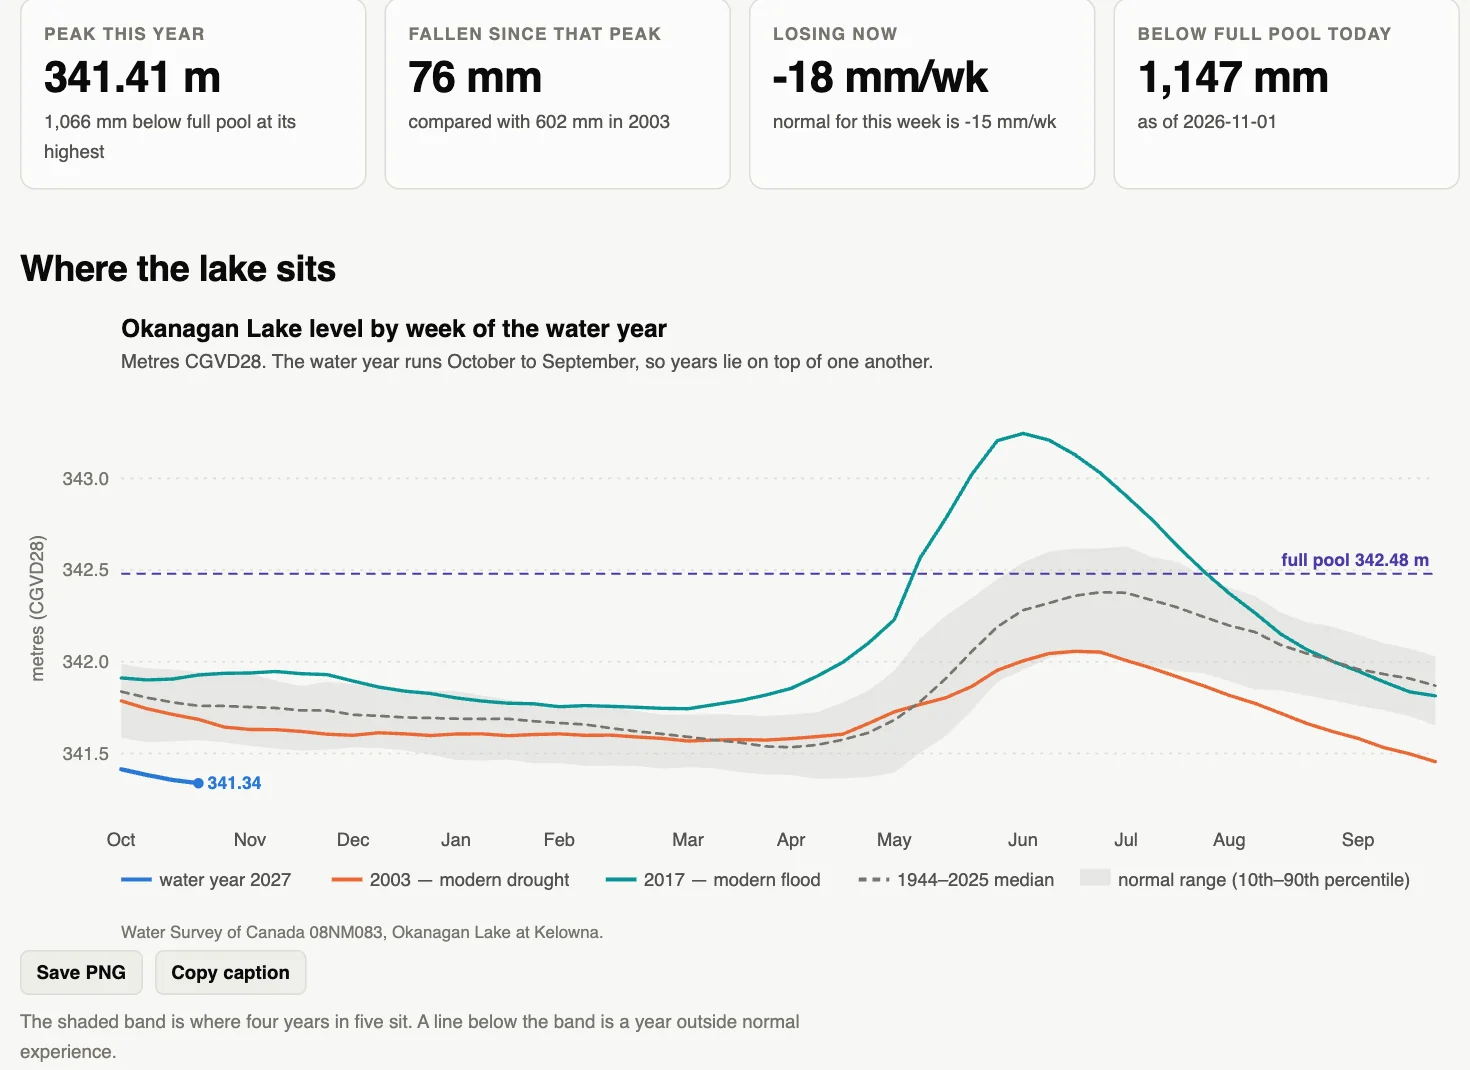
This year's level against the modern drought year (2003), the modern flood year (2017) and the 1944 to 2025 normal. The 2026 peak was 341.41 m, 1,066 mm below full pool. The lake has fallen 76 mm since that peak (602 mm in 2003). The lake did not drain unusually fast; it never filled.
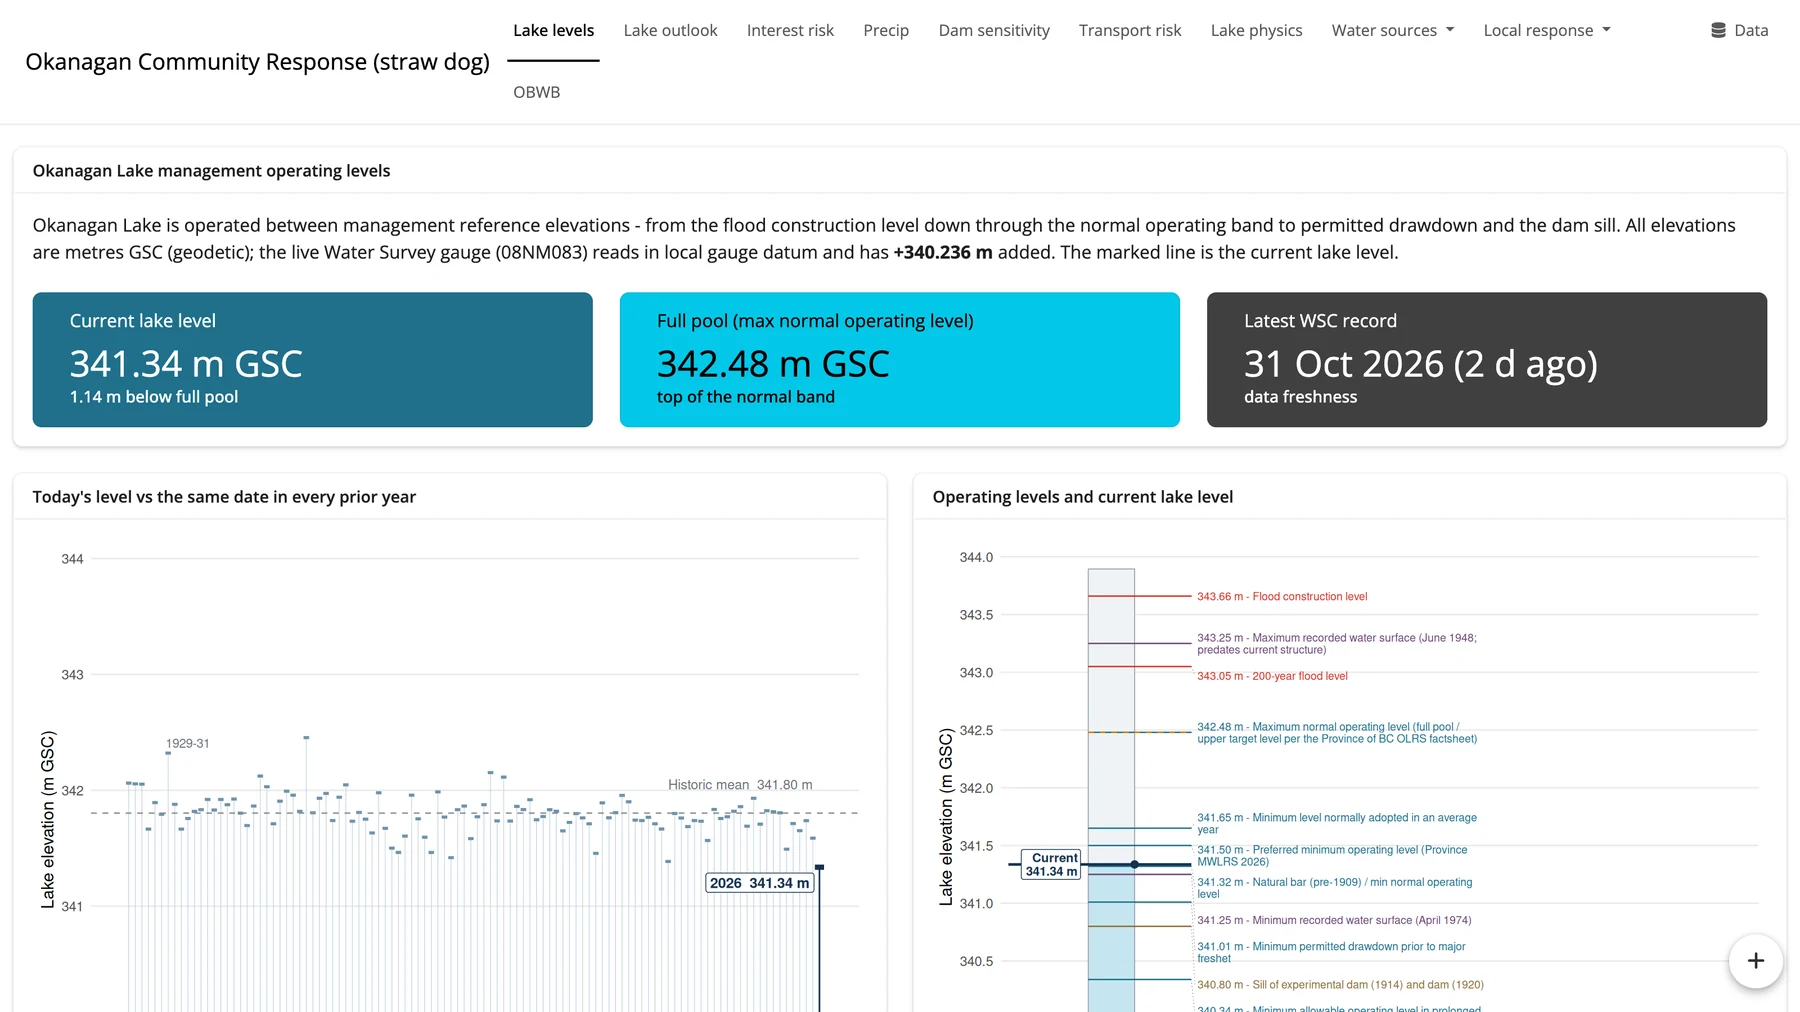
Current level 341.34 m (GSC), 1.14 m below full pool. Left: today's level against the same date in every prior year. Right: the current level against the operating reference elevations, from flood construction level down to the dam sill. Login-gated straw dog for local governments.
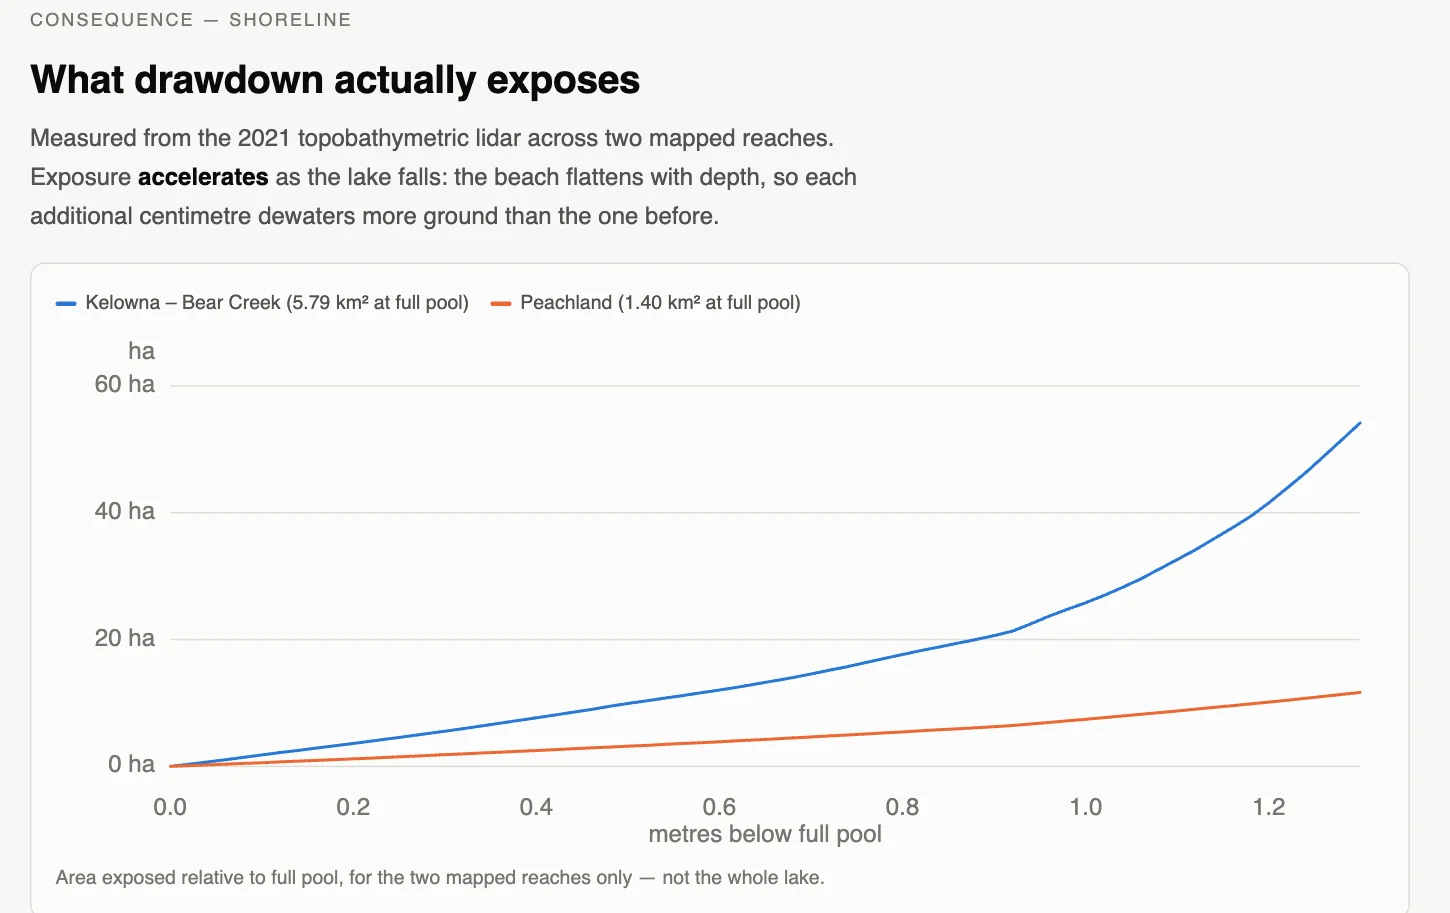
Lakebed exposed as the lake falls below full pool, measured from 2021 lidar on two mapped reaches (Kelowna to Bear Creek, Peachland). Exposure accelerates as the lake falls: each extra centimetre dewaters more ground than the one before. Two reaches only, not the whole lake.
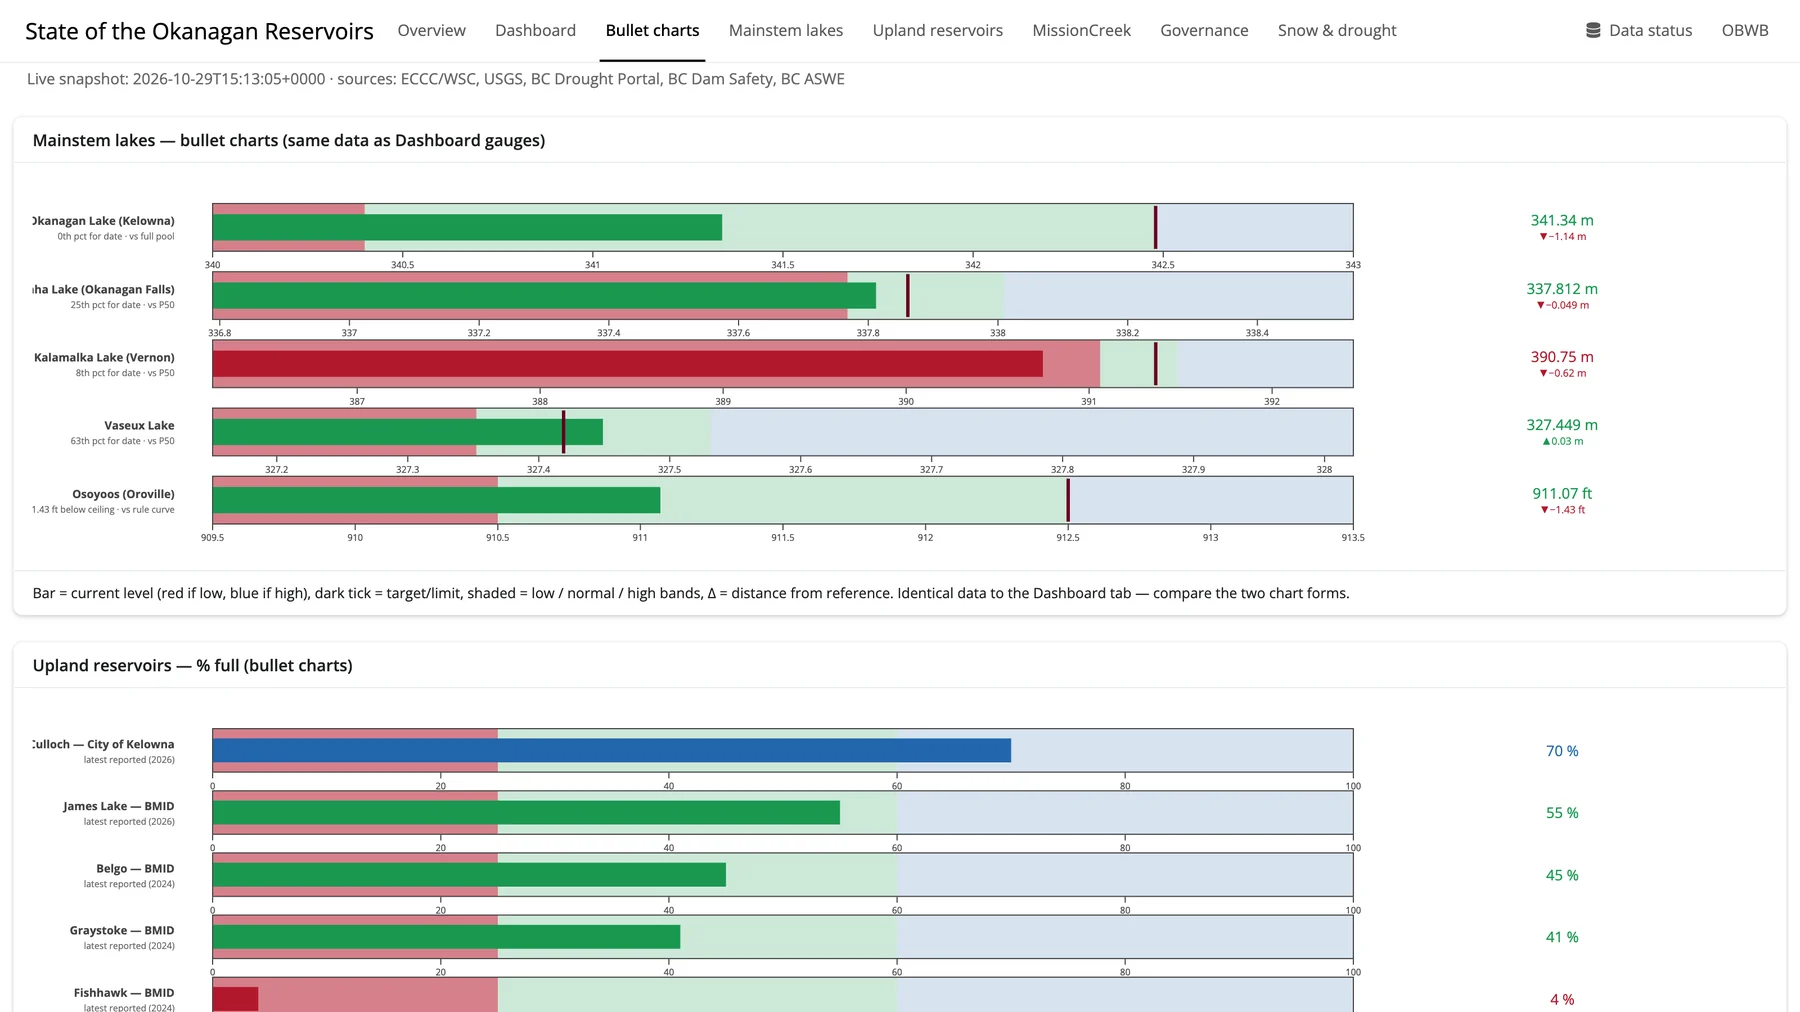
Bullet charts: the bar is the current level (red if low), the dark tick is the target, and shading marks the low, normal and high bands. Kalamalka Lake is in the red. Below, upland reservoirs are shown as percent full, from 70% down to 4% at the latest report.
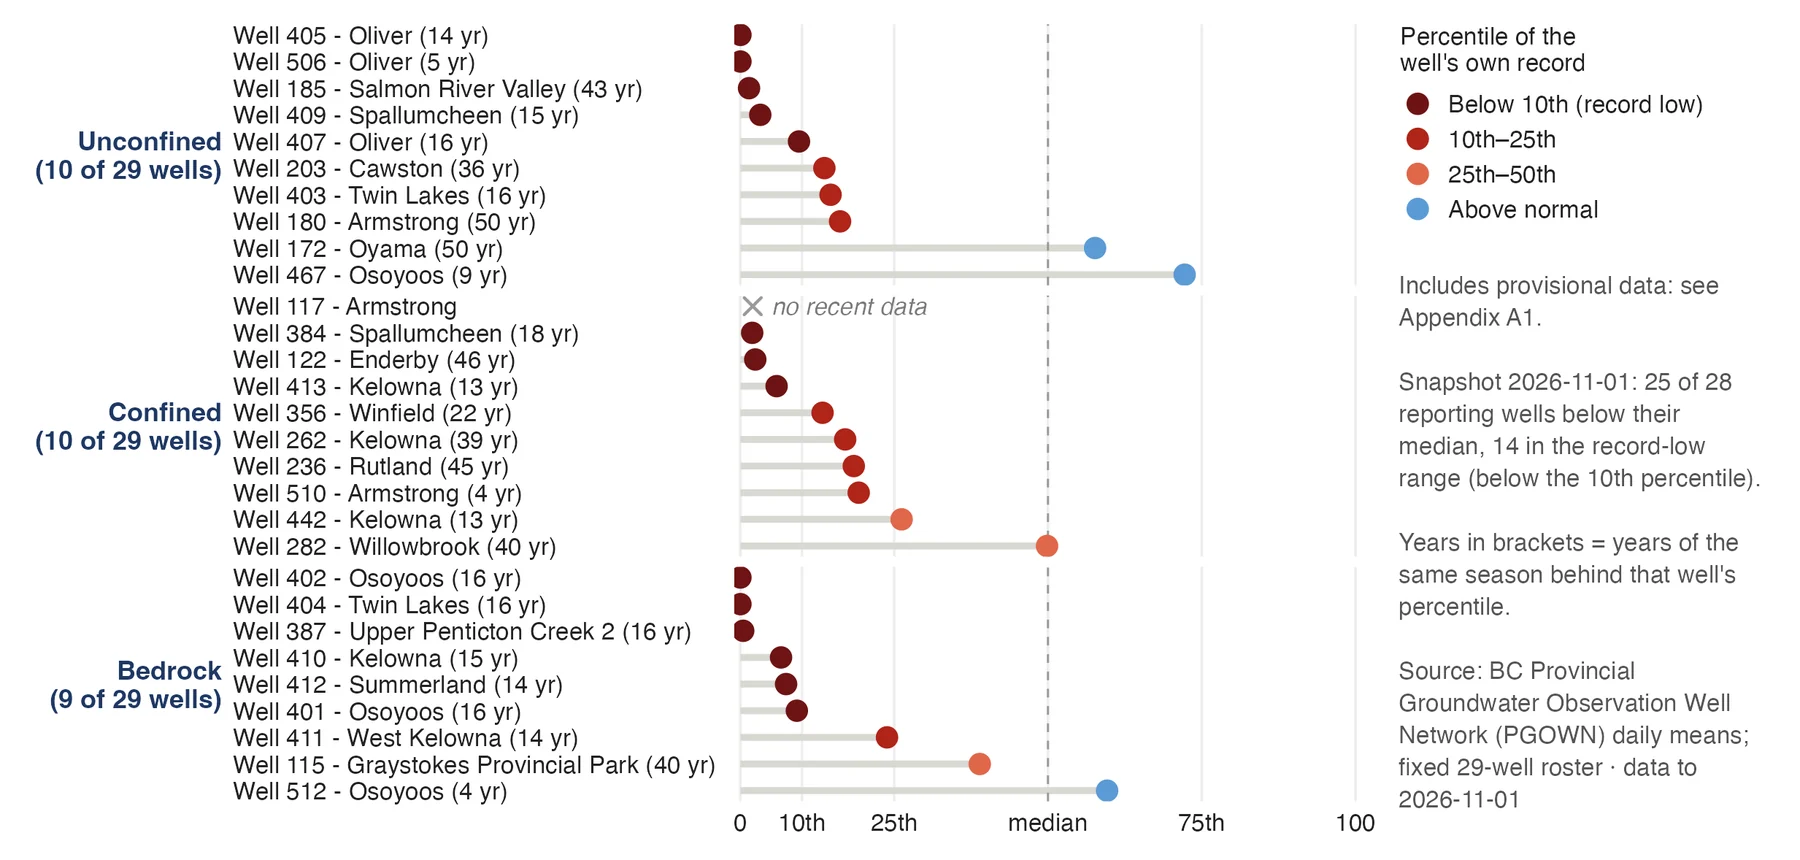
Each provincial observation well ranked against its own record for the date, grouped by aquifer type. 25 of 28 reporting wells are below their median and 14 are in the record-low range (below the 10th percentile). Bedrock wells sit lowest.
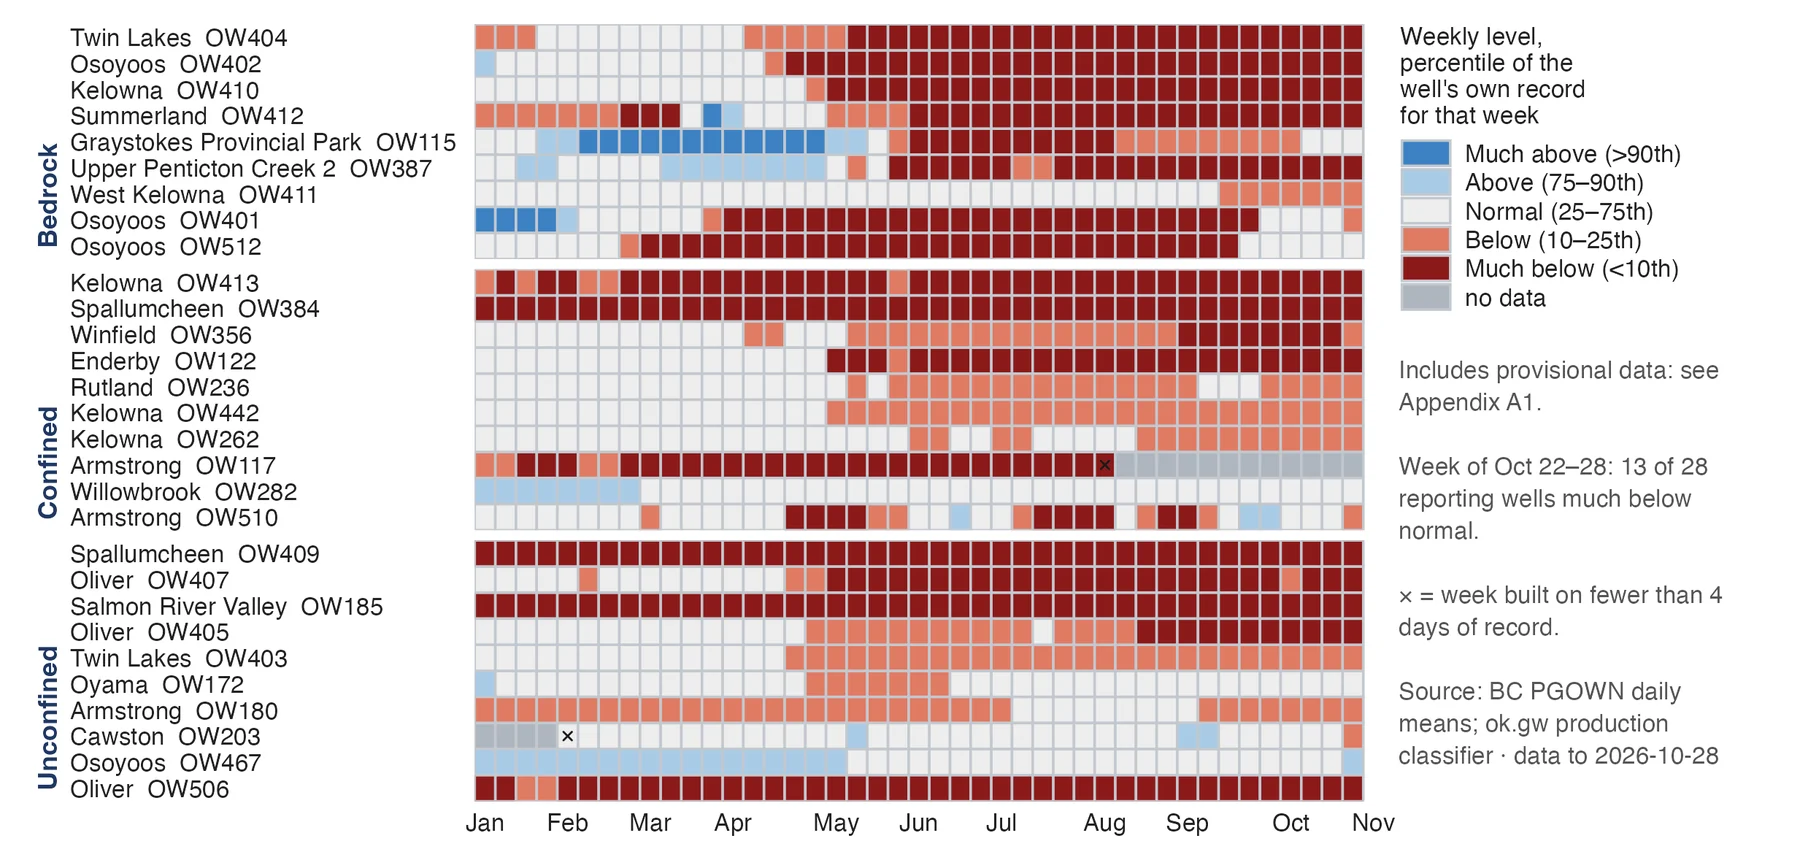
Each cell is one well in one week, scored against that well's own record for the time of year. Most wells crossed into below normal in April and May and have stayed there. In the week of 22 to 28 October, 13 of 28 reporting wells were much below normal.
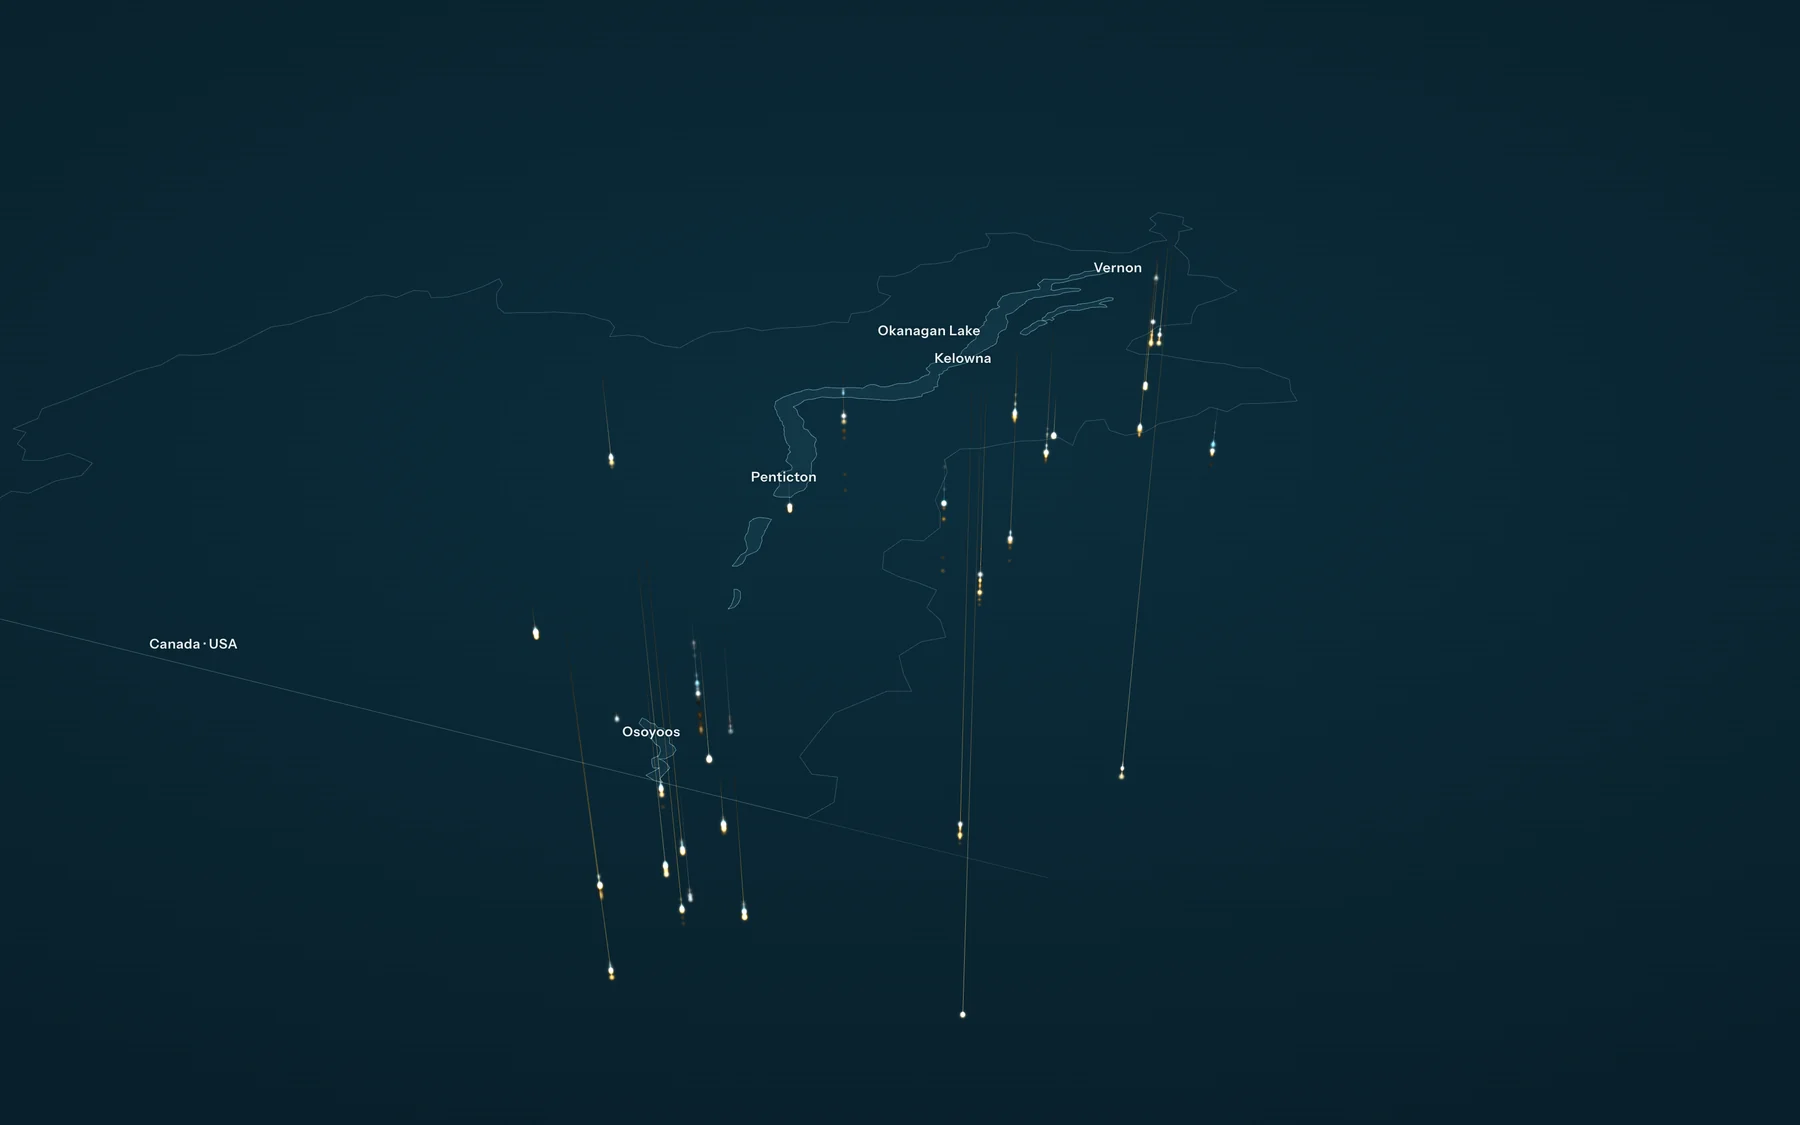
Depth to water in 32 provincial wells, each year against the well's own record, drawn in 3D (1 m of depth = 1.5 km on screen). In 2026, 18 of 27 wells with a normal sat below it from January to September, 10 much below, and 5 at their lowest since installation. From 2005 to 2025 the median trend is 0.00 m a year: a low year on a flat record.
Static 2026 frame of the same scene, as used at the Water Supplier Community of Practice (29 Oct 2026). Amber is deeper than the well's normal, cyan wetter, pale normal; the white dot is normal depth. Town labels and legend in this image fall below 12 pt at slide width, so title, legend and source go in slide text.
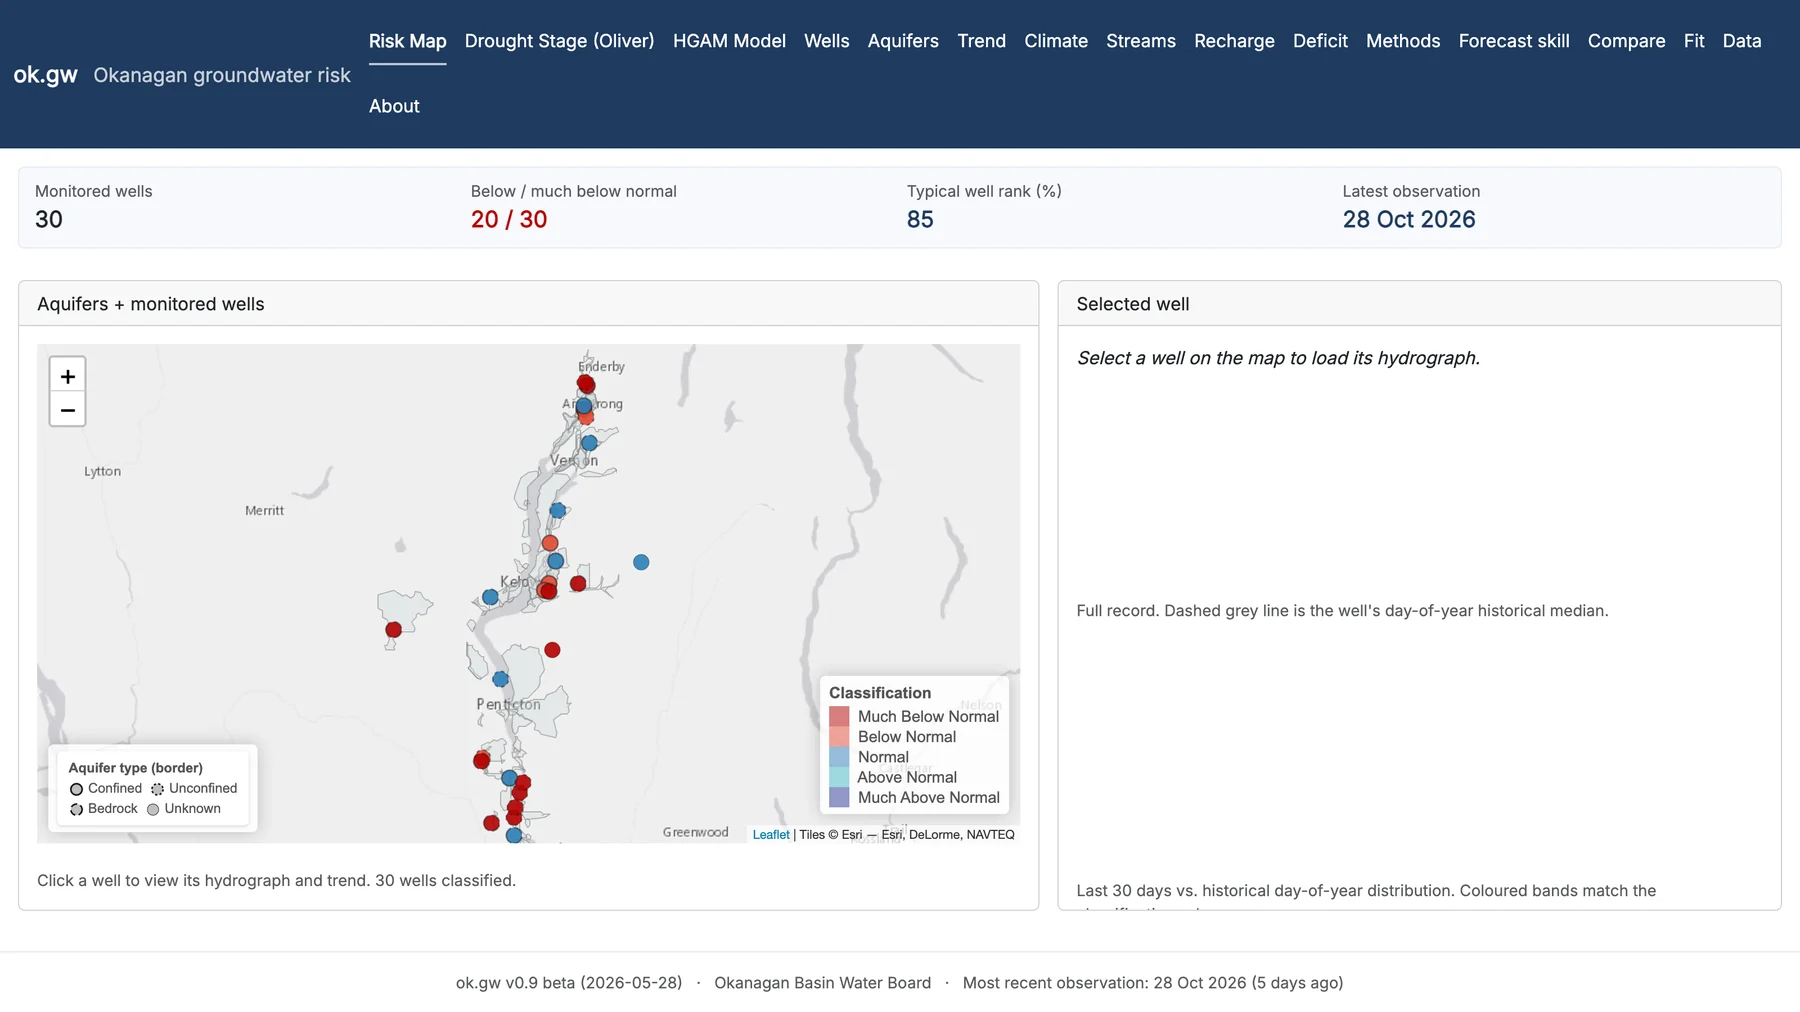
30 monitored wells on a map, coloured by classification against their own record. 20 of 30 are below or much below normal. Select a well to load its hydrograph and 30-day position against the historical distribution.
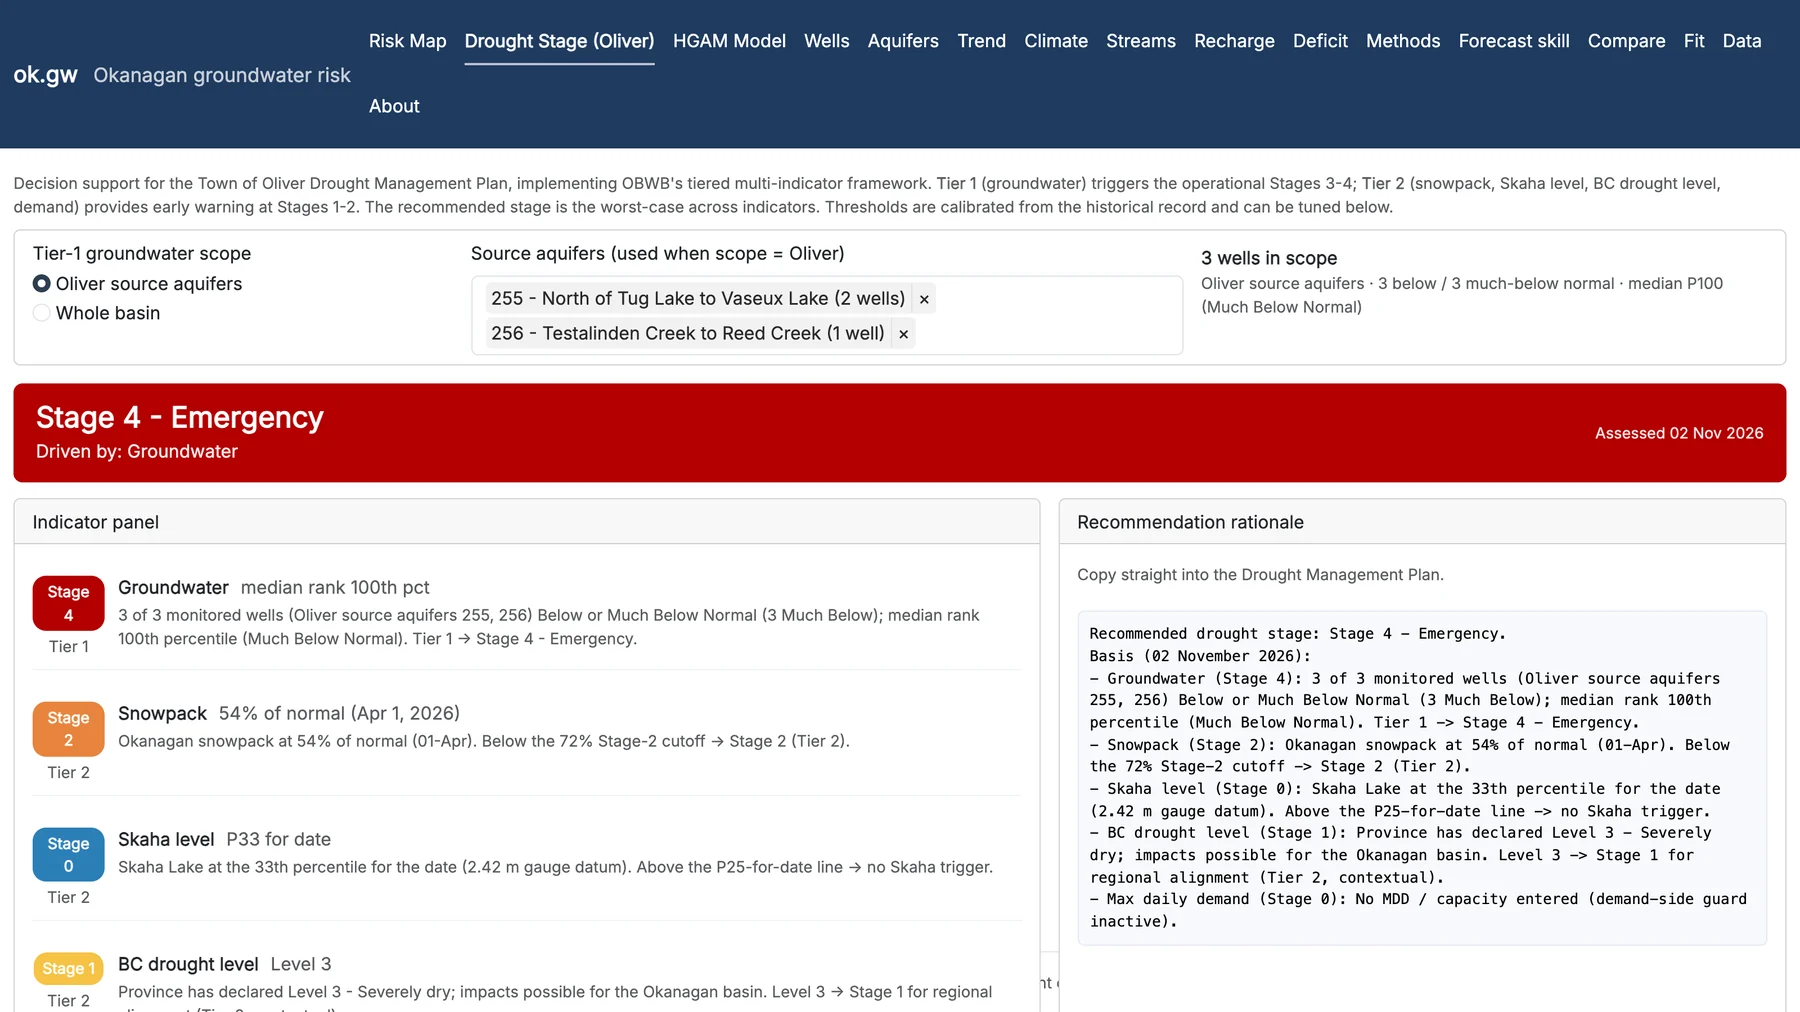
Decision support for the Town of Oliver Drought Management Plan. Assessed 2 November: Stage 4, Emergency, driven by groundwater (3 of 3 monitored wells in Oliver source aquifers 255 and 256 below or much below normal). Snowpack (Stage 2) reads 54% of normal here: the mean of Okanagan manual snow courses, each against its own 1991 to 2020 normal. Slide 4's 58% is the published April 1 basin figure, a different index.
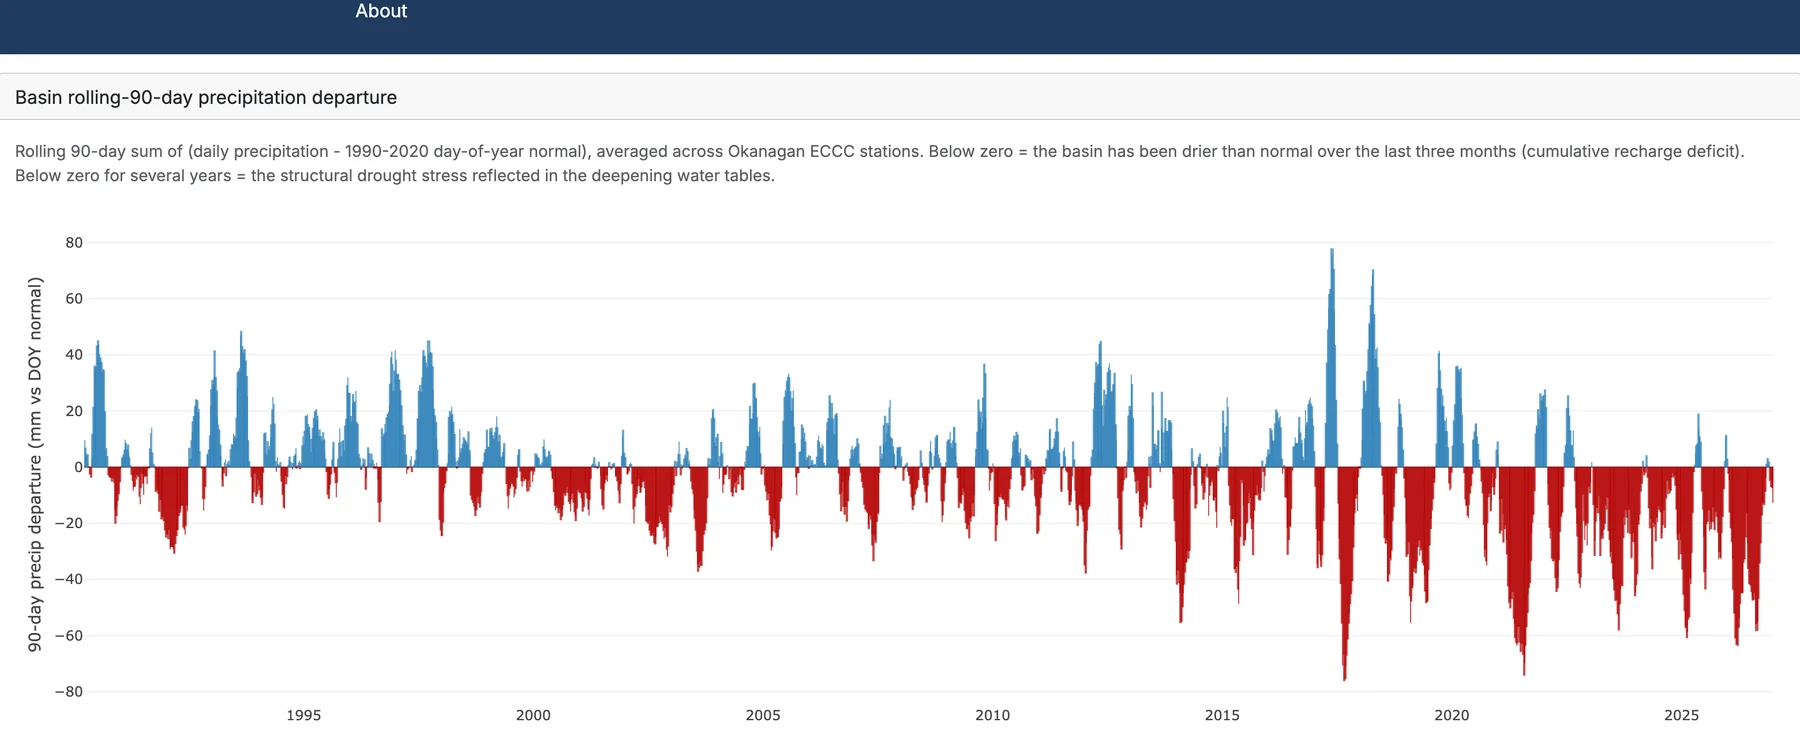
Rolling 90-day precipitation minus the 1990 to 2020 normal, averaged across Okanagan ECCC stations, since the 1990s. Red is drier than normal. Long runs below zero mark the cumulative recharge deficit behind the falling water tables.
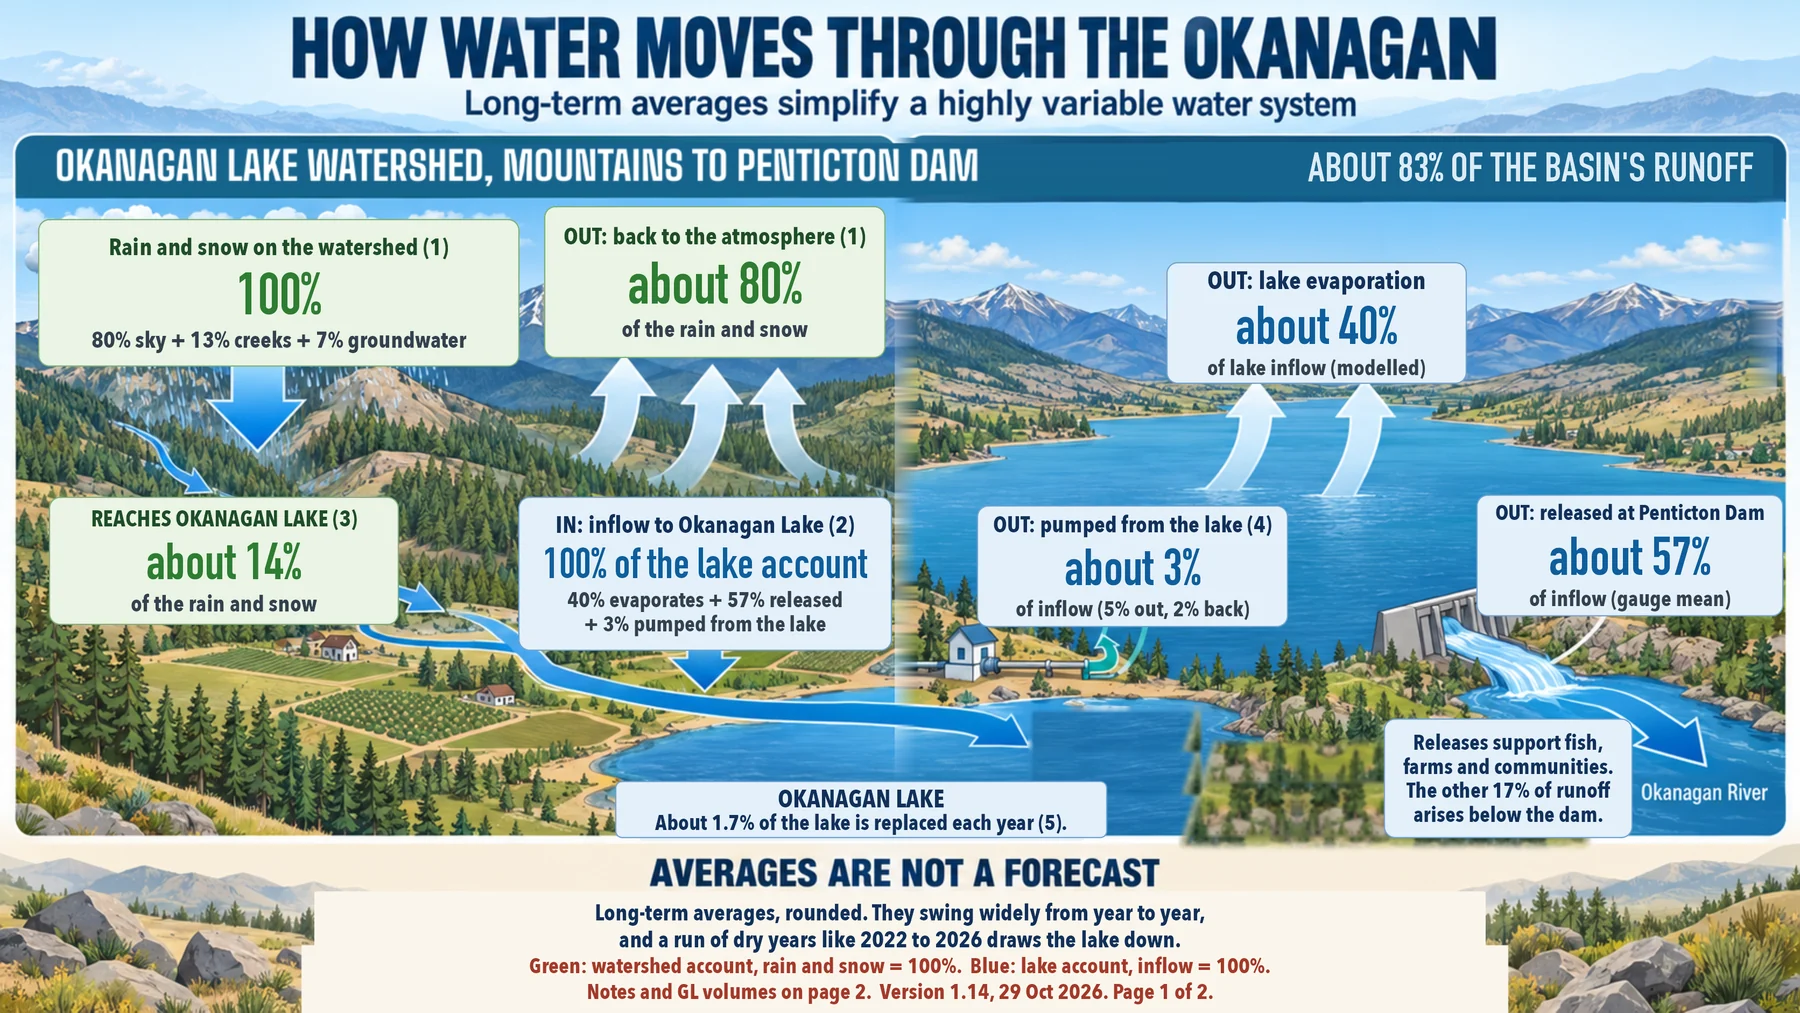
Long-term averages, not a forecast. Of the rain and snow on the watershed, about 80% returns to the air, 13% runs off to creeks and 7% soaks into groundwater. Of what reaches Okanagan Lake, about 40% evaporates, 57% is released at Penticton Dam and 3% is net community use. Only about 1.7% of the lake's volume is replaced in a year.
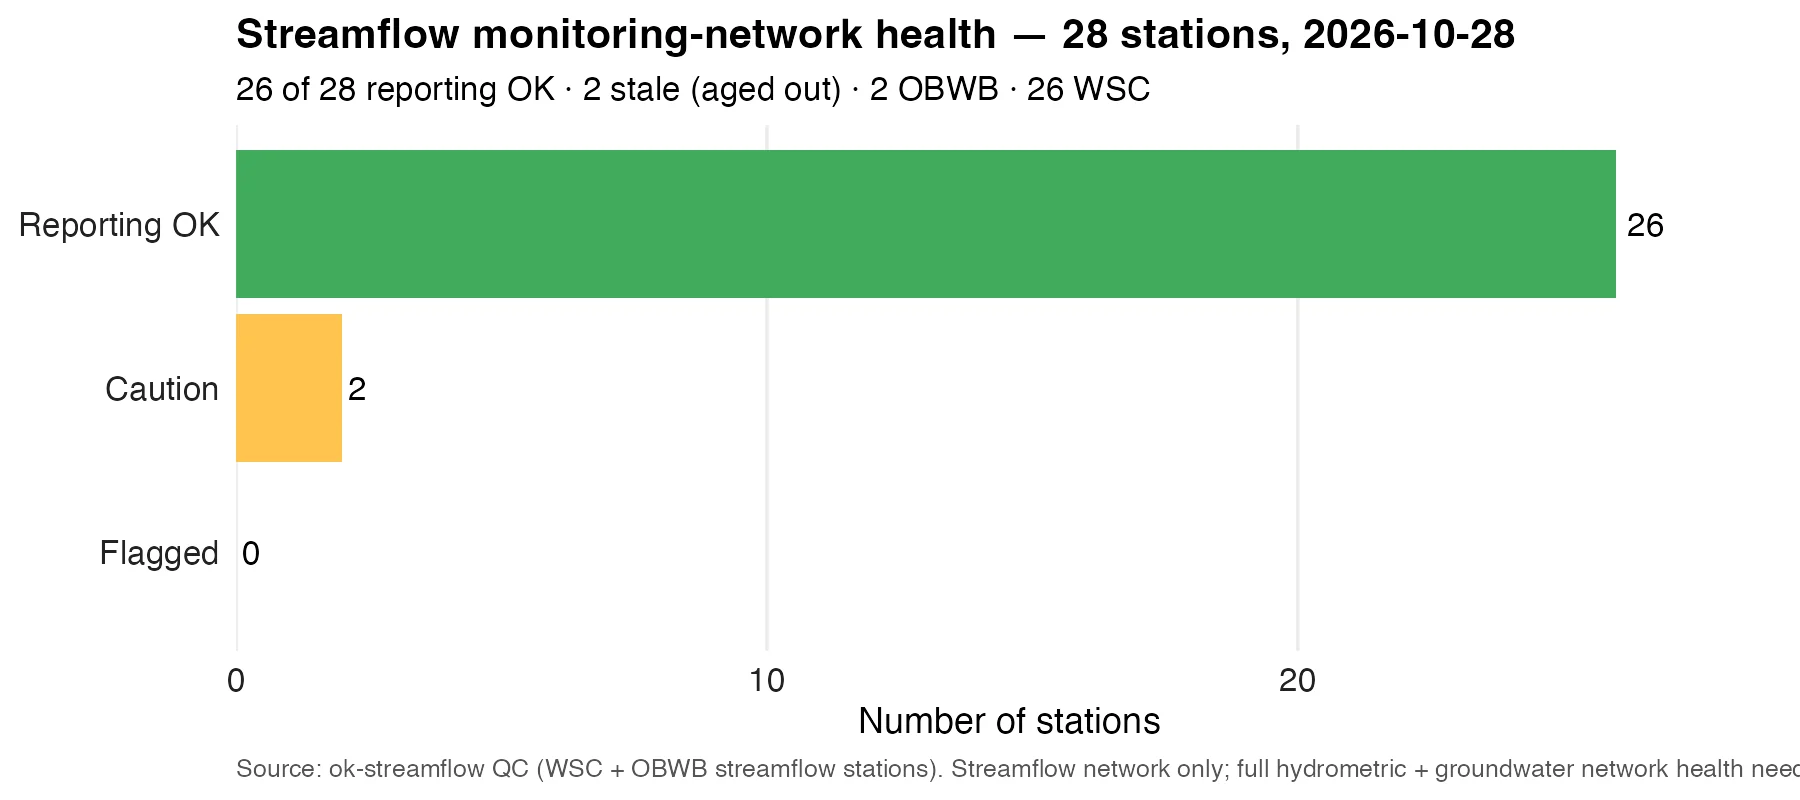
Of 28 streamflow stations feeding these graphics, 26 are reporting normally and 2 are stale (aged out). 2 are OBWB stations and 26 are WSC. Most recent values on every platform are provisional real-time data, subject to revision.